. 2019 Apr 29;10(22):5793–5800. doi: 10.1039/c9sc01666j

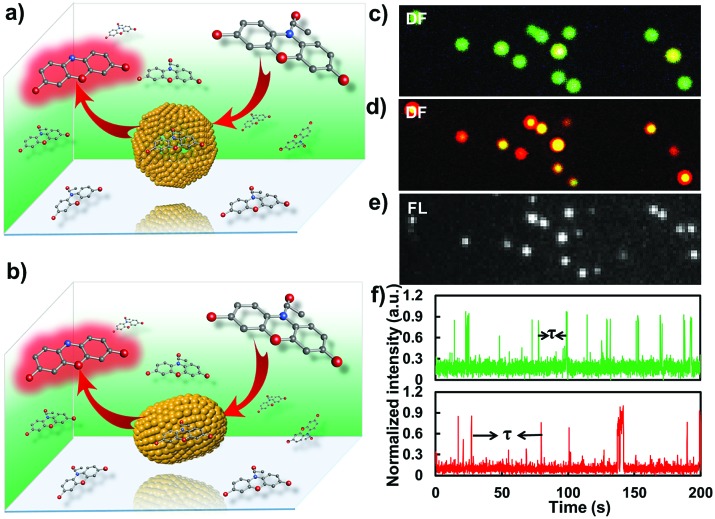
Fig. 5. Fluorescence characterizations of the catalysis process from a single nanoparticle with single-turnover resolution. (a and b) illustrate the single-molecule catalysis from the gold nanoparticle before and after laser melting, respectively. (c and d) Dark-field images of the gold nanoparticles before and after the laser melting process, respectively. (e) The corresponding fluorescence microscopic characterization of the catalytic process from individual GNRs. (f) Representative time-dependent fluorescence intensity trajectories of the catalysis process from single gold nanoparticles before (green) and after (red) the laser melting process.

Fig. 5