. 2019 Apr 29;10(22):5793–5800. doi: 10.1039/c9sc01666j

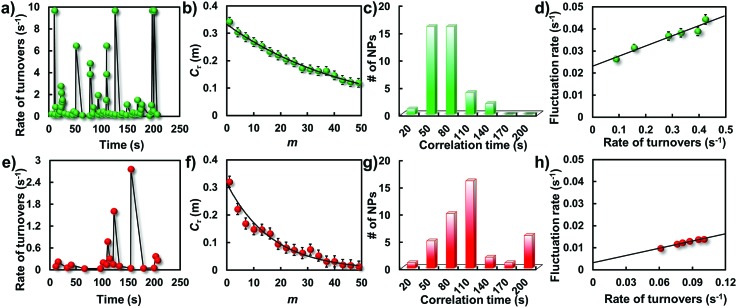
Fig. 7. Single-particle catalytic dynamics. Trajectories of rate of turnovers from a single gold nanostructure before (a) and after (e) laser melting at an amplex red concentration of 1.5 μM. Autocorrelation functions of τ derived from the single-turnover trajectories before (b) and after (f) laser melting. Solid lines are exponential fits with decay constants of m = 47.6 and 16.7 turnovers, respectively. Histograms of fluctuation correlation times for the catalytic reaction before (c) and after (g) laser melting. Dependence of the activity fluctuation rate (the inverse of fluctuation correlation time) on the rate of turnover before (d) and after (h) laser melting.

Fig. 7