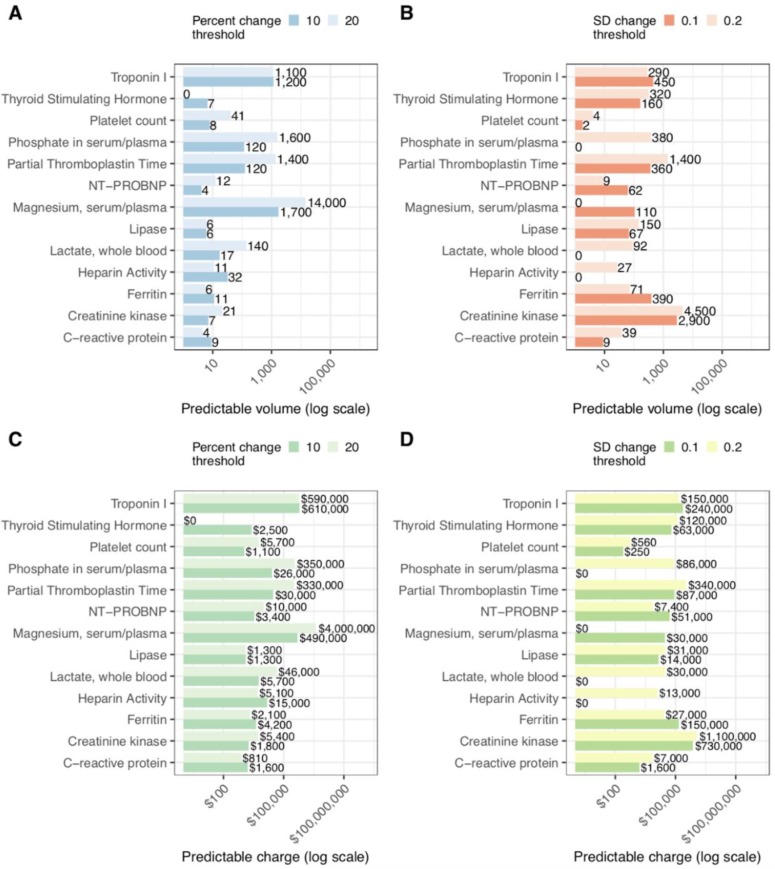
Figure 4:
Estimates of predictable testing volume for percent (A) and SD change (B) for 2016 at Stanford University Hospital. Calculated charges of predictable tests under percent (C) and SD (D) frameworks for stability. All horizontal axes are on a logarithmic scale, with charges in United States Dollars (USD). For example, if we restrict only to predictions we can make with >99% accuracy, we estimate that approximately 1,200 repeat measurements of troponin I in 2016 can be predicted to be within ± 0.1 SD with of the previous measurement. This amounts to over $600,000 USD in charge volume.

