
Figure 1:
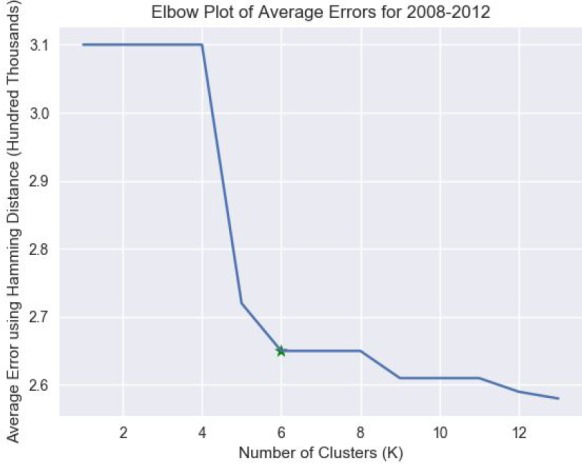
The plot of the average errors across years 2008-2012 for the various number of clusters. The star denotes the elbow. Note that the errors were calculated as the sum of all the Hamming distances between the cluster centroid and the cluster samples.