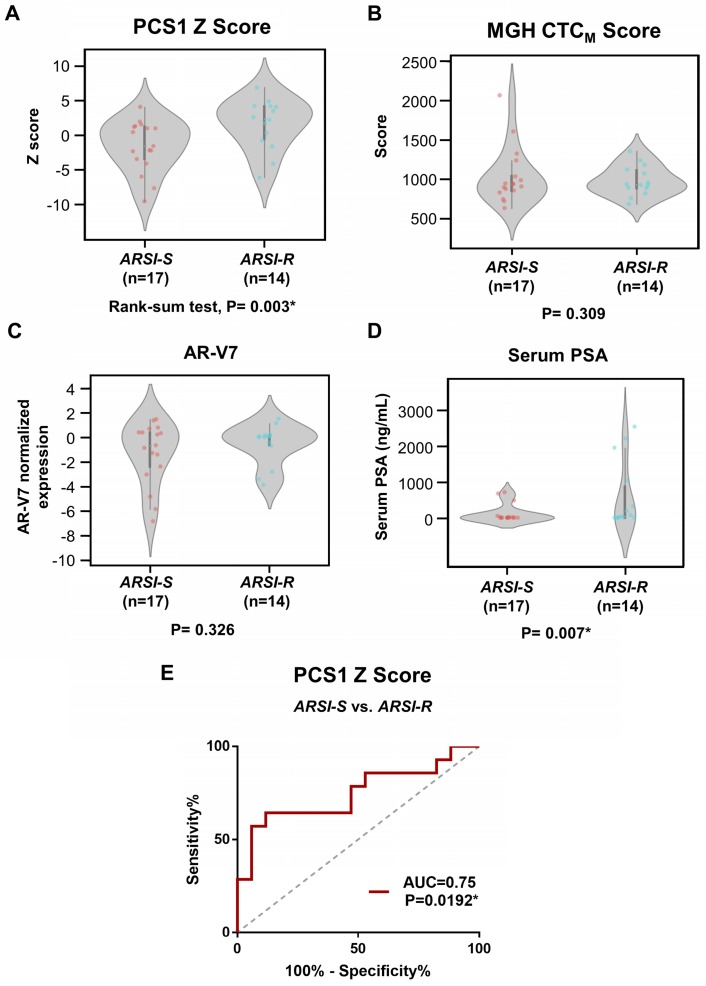
Figure 6.
Analysis of gene scores between ARSI-S and ARSI-R samples. Comparison of (A) PCS1 Z score and (B) MGH CTCM score among 31 mCRPC samples, with 17 samples from ARSI sensitive state (ARSI-S), and 14 samples from ARSI resistant state (ARSI-R). PCS1 Z score is statistically significant higher in resistant patients (Rank-sum test, P=0.003*). No statistically significant trend was found in MGH CTCM score between the 2 groups (P=0.309). Similar tests performed using (C) AR-V7 expression and (D) serum PSA level are also shown. Serum PSA level exhibits statistically significant higher value in the resistant patients (P=0.007*). (E) Receiving Operating Characteristics (ROC) curve analysis of PCS1 Z score separating ARSI-S and ARSI-R patients. ROC curve exhibits Area Under Curve (AUC)= 0.75, P=0.0192*.

