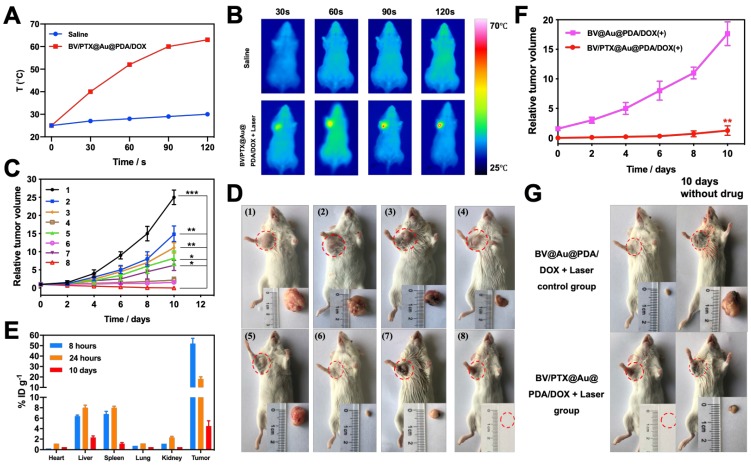
Figure 4.
(A) Photothermal heating curves and (B) infrared thermal images in the tumor region of tumor-bearing mice treated with saline and BV/PTX@Au@PDA/DOX followed by laser irradiation (1.5 W cm-2 for 2 min). (C) Tumor growth profiles in different groups of the mice after various treatments. (D) Representative photographs of tumor-bearing mice and tumors after 10 days of treatments. Group 1: saline, 2: BV/PTX, 3: BV/PTX@Au, 4: BV/PTX@Au with laser irradiation, 5: BV@Au@PDA/DOX, 6: BV@Au@PDA/DOX with laser irradiation, 7: BV/PTX@Au@PDA/DOX and 8: BV/PTX@Au@PDA/DOX with laser irradiation. (*P < 0.05, **P < 0.01, ***P<0.001 compared with saline group). (E) Biodistribution of BV/PTX@Au@PDA/DOX in mice at different times after the intratumor injection. The accumulation of BV/PTX@Au@PDA/DOX in tissues was confirmed by measuring the Au content in the major organs and tumor tissues via ICP-MS. (F) Tumor growth curve of the next 10 days without treatment (treated with BV@Au@PDA/DOX and BV/PTX@Au@PDA/DOX with laser irradiation in previous 10 days). (**P < 0.01). (G) Representative photographs of tumor-bearing mice and tumors with treatments of BV@Au@PDA/DOX and BV/PTX@Au@PDA/DOX under laser irradiation and next 10 days without treatment. The data are presented as the mean  S.E. (n = 6).

