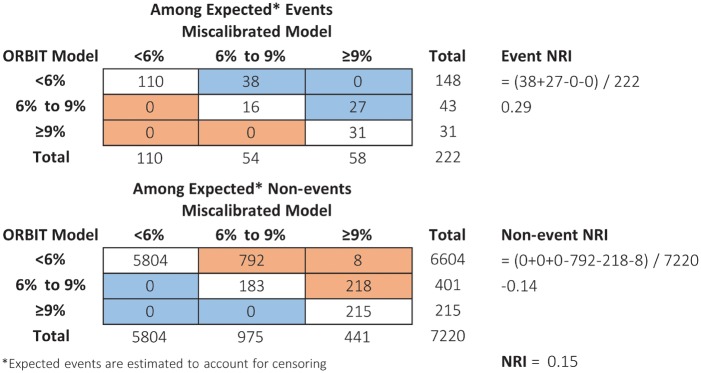
Figure 3.
Reclassification table where blue cells indicate patients whose risk prediction improved under the miscalibrated model, and orange cells indicate patients whose risk prediction worsened under the miscalibrated model (higher risk prediction is good for events and bad for non-events). Event NRI = [# up – # down]/total events; Non-event NRI = [# down – # up]/total non-events; NRI = Event NRI + non-event NRI. NRI, net reclassification index.

