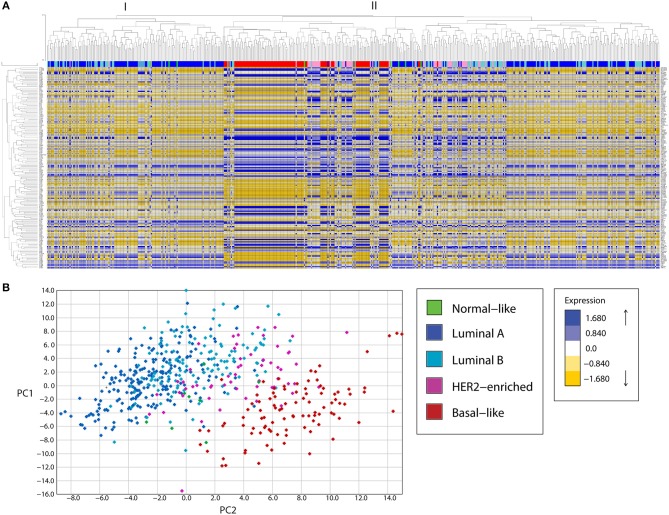
Figure 1.
A mitochondria-related gene signature separates breast cancer tumor samples in clusters according to the tumor subtype, in a bioinformatic analysis of gene expression. (A) A mitochondria-related gene expression signature was analyzed in TCGA breast tumor samples using unsupervised hierarchical clustering analysis, revealing clusters of samples enriched in molecular subtypes. Two major clusters were found (I, II). Cluster I was enriched in luminal samples while cluster II showed two major sub-groups. The first subgroup was enriched in basal and HER-2 enriched samples while the other was heterogeneous with one sub-group enriched in luminal samples and another containing luminal B and HER2-enriched tumors. (B) Principal component analysis (PCA) revealed three main clusters, a cluster of Luminal A and B tumors (left), an intermediate group composed of HER2-enriched and some Luminal B samples and a Basal-like enriched cluster (right). PC, principal component.

