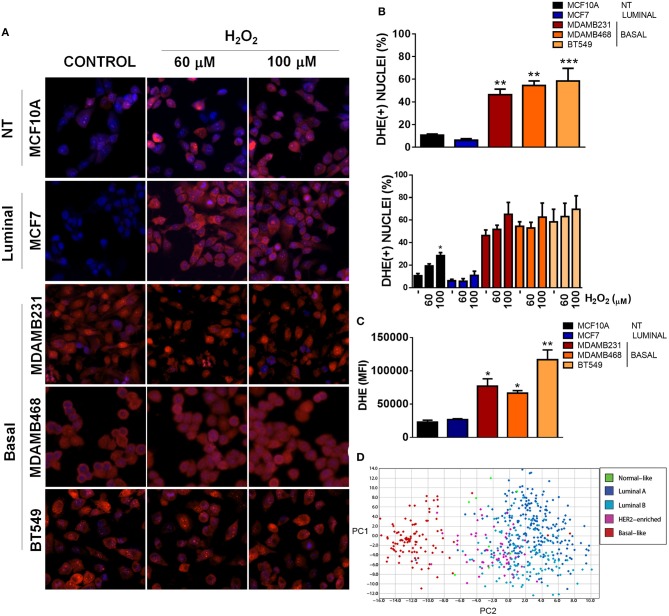
Figure 3.
Basal, TNBC cell lines have elevated ROS levels when compared to non-tumorigenic or luminal breast cancer cell lines. (A) ROS levels were evaluated by fluorescence microscopy using dihydroethidium (DHE) staining (red) and total nuclei were stained with Hoechst (blue). Cells were treated with the indicated concentrations of H2O2. (B) DHE positive nuclei were counted and graphed as a percentage of total nuclei. (C) ROS levels were quantitatively evaluated by flow cytometry in the different cell lines. (D) A ROS-related gene signature PCA analysis clearly clustered basal-like tumors separate from the other breast cancer subtypes. Graphs show mean ± SEM of 3–5 independent experiments, *Different to MCF10A and MCF7 or to their respective control with *p < 0.05; **p < 0.01, and ***p < 0.001. PC, principal component.

