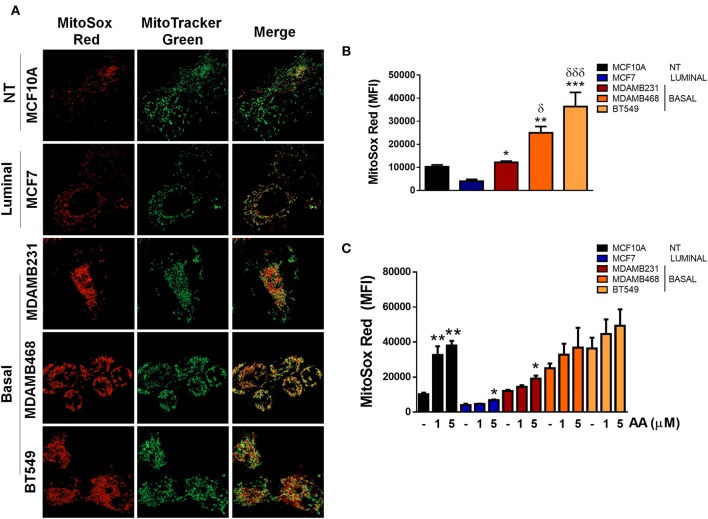
Figure 5.
ROS in basal, TNBC cell lines are derived from the mitochondria. (A) Mitochondria were stained with Mitotracker (green) and MitoSox (red) to evaluate production of mitochondrial ROS. (B) Quantification of MitoSox fluorescence was performed by flow cytometry in basal conditions or (C) in cells treated with Antimycin A (AA) at the indicated concentrations. Graphs show mean ± SEM of 3 independent experiments. In (B) *different to MCF7 and δdifferent to MCF10A. In (C) *different to control. *p < 0.05; **p < 0.01; ***p < 0.001; *δ <0.05; and ***δδδ <0.001.

