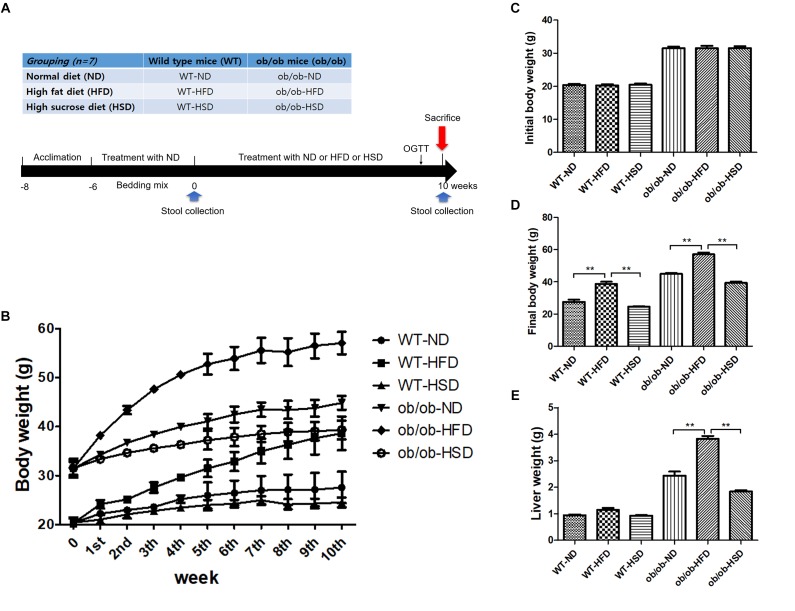
FIGURE 1.
Experimental design, body and liver mass. Grouping of mice and treatment schedule (A). Body weights of mice were recorded from the beginning of the experiment to week 10 (B), initial week (C), and final week (D). Liver weights of mice were recorded from the final week (E). Data were expressed as the means ± SEM and statistically evaluated using one-way ANOVA followed by Bonferroni’s post hoc test. ∗∗P < 0.01 (n = 7).

