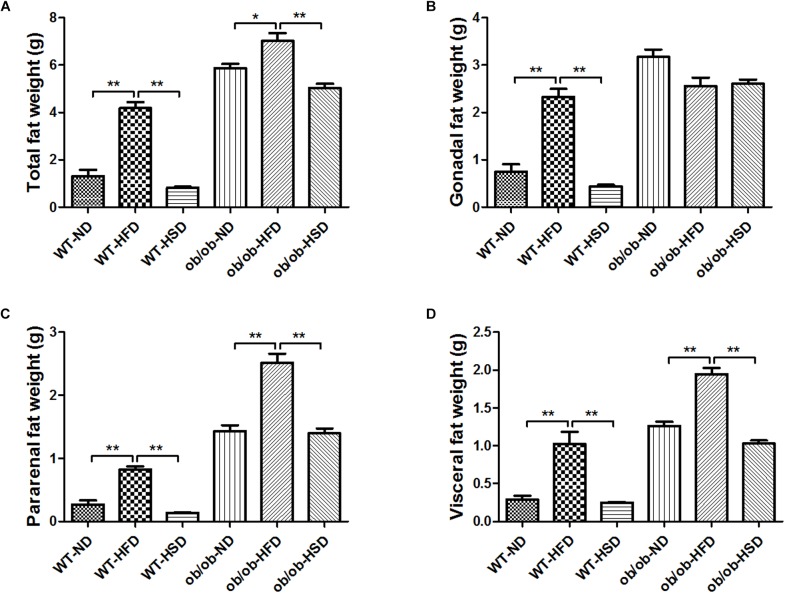
FIGURE 3.
Adipose tissues weights. At the end of the experiment, total fat weight (A), gonadal fat (B), pararenal fat (C), and visceral fat (D) mass were determined and calculated. Data were expressed as the means ± SEM and statistically evaluated using one-way ANOVA followed by Bonferroni’s post hoc test. ∗P < 0.05; ∗∗P < 0.01 (n = 7).

