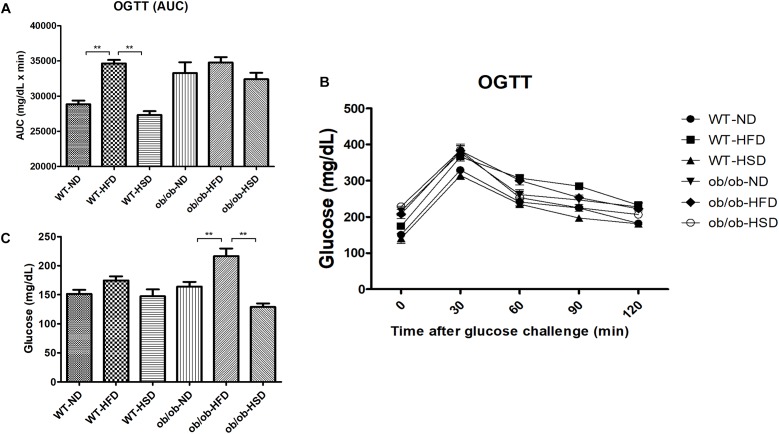
FIGURE 5.
Fasting glucose and OGTT. Fasting blood glucose (C) was determined on the last day of experiment. Oral glucose tolerance tests (OGTTs) (A) were performed on the animals during the last week and the areas under the curves (AUCs) (B) were constructed as described in the see section “Materials and Methods”. Data were expressed as the means ± SEM and statistically evaluated using one-way ANOVA followed by Bonferroni’s post hoc test. ∗∗P < 0.01 (n = 7).

