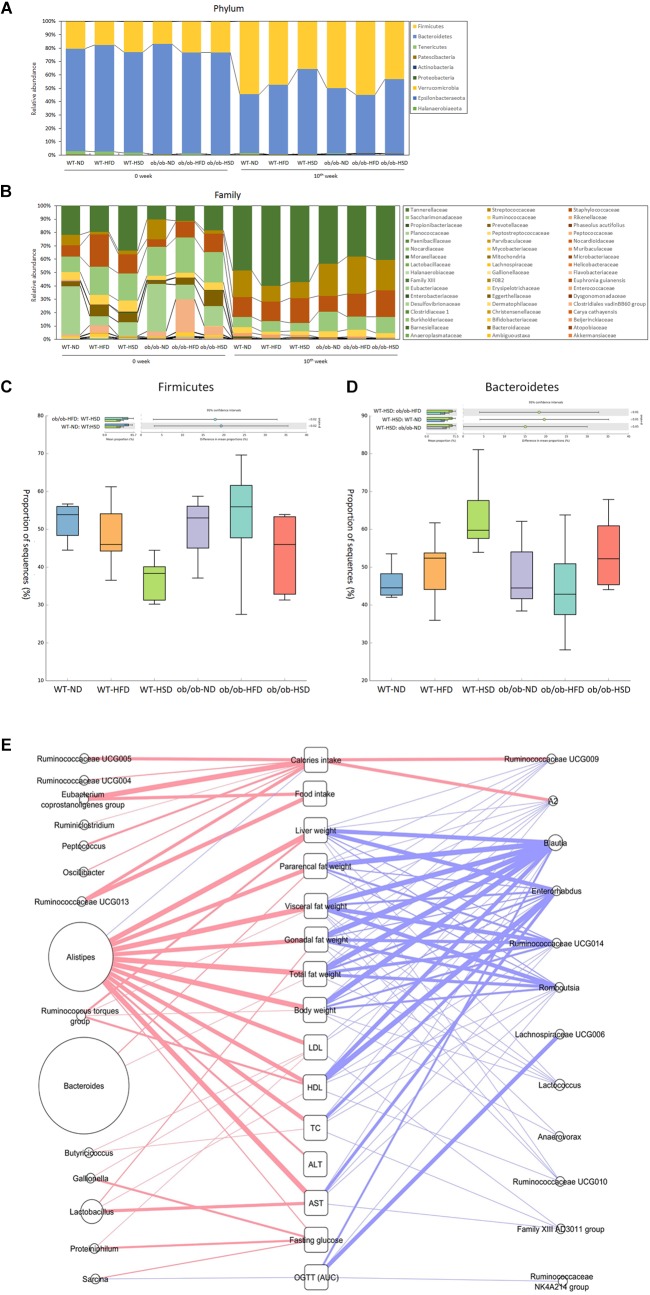
FIGURE 8.
Phylum and family level composition of fecal microbiota and Pearson’s correlation analysis. Gut microbiota taxonomic profiles. The relative abundance (%) of fecal bacterial phyla (A) and families (B) were compared according to the 16S rRNA gene sequencing data. The proportion of sequences (%) of firmicutes (C) and Bacteroidetes (D) were compared. Taxonomic differences in results were statistically analyzed and represented graphically using the STAMP v2.1.3 software (Dalhousie University, Halifax, Canada). (E) All of the gut microbiota composition and host parameters data were evaluated using Pearson’s correlation analysis, with a R value greater than 0.4 indicating a positive correlation (red line) and a R value less than –0.4 indicating a negative correlation (blue line). The boldness of the line indicates the strength of the correlation. The size of each circle indicates the average relative abundance of each genus.

