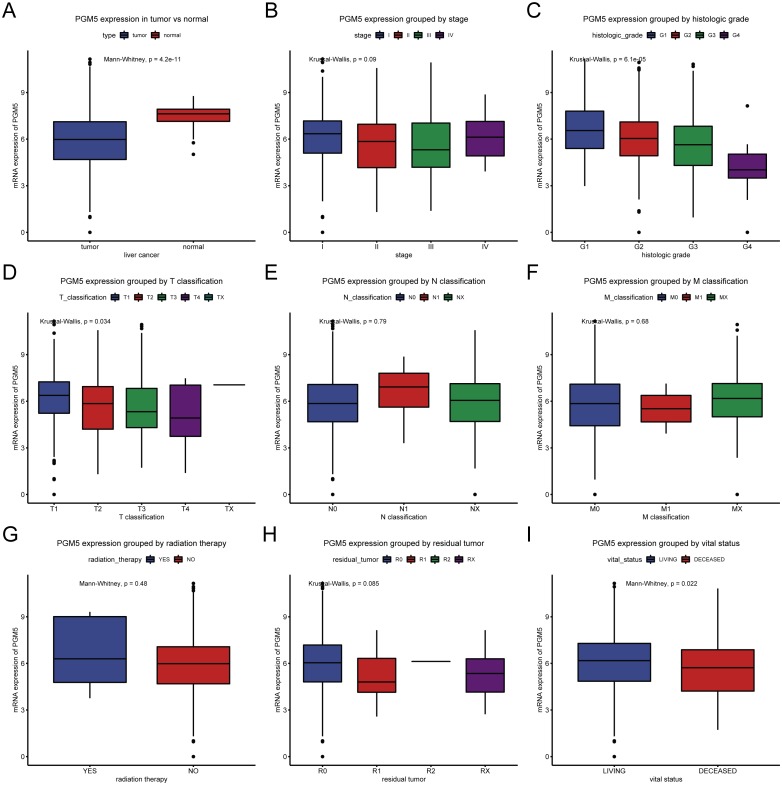
Figure 1. Expression of PGM5 in liver cancer.
Expression of PGM5 in cancerous vs. adjacent normal liver tissues (A), and according to clinical stage (B), histologic grade (C), TNM classification (D–F), receipt of radiation therapy (G), presence of residual tumor (H), and survival (I). Each box plot shows the median (center line), upper and lower quartiles (box), 95% confidence intervals (vertical lines), and outliers (points).

