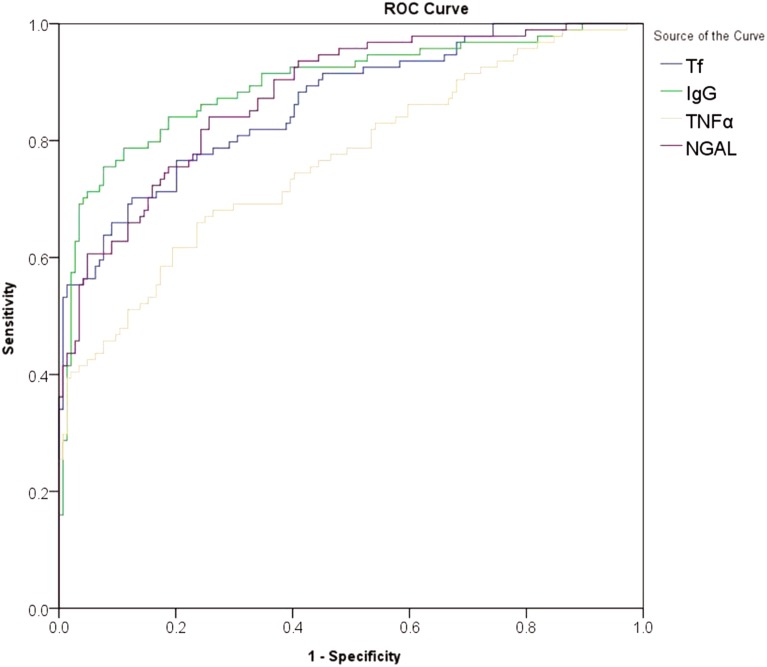
Figure 1. ROC curves for the diagnosis of early-stage diabetic nephropathy using urinary Tf, IgG,NGAL, and TNF-α.
The abscissa represented specificity, the ordinate represented sensitivity, and the area under the curve represented the diagnostic value of urinary Tf, IgG,NGAL, and TNF-α in the early-stage diabetic nephropathy.

