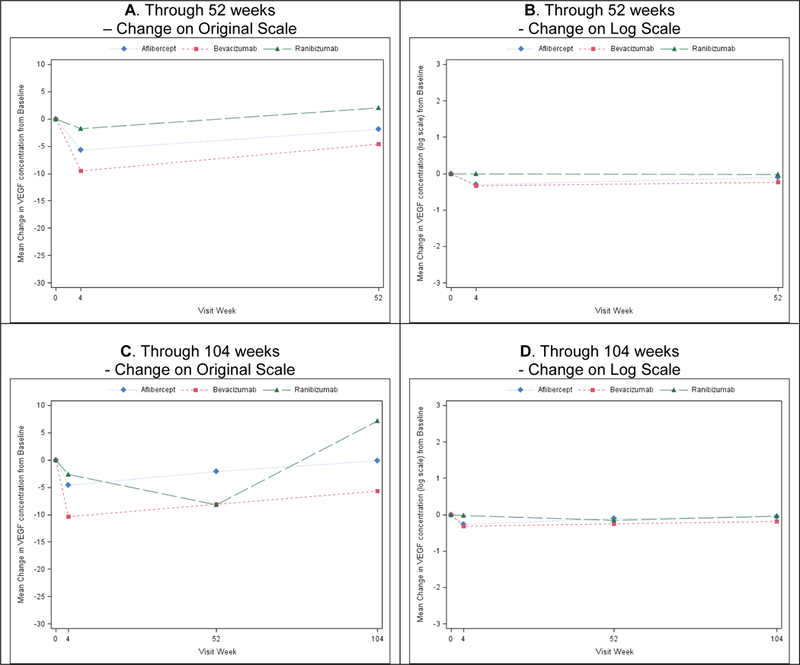
Figure 2. Mean Change in Plasma VEGF Concentrations (pg/ml) by Treatment Group Assignment in Participants with Complete Data through 52 and 104 Weeks.

A) Through 52 weeks on original scale. B) Through 52 weeks on log scale. N=122/ 111/ 121 for aflibercept/ bevacizumab/ ranibizumab group. Pairwise comparisons for aflibercept vs. bevacizumab/ aflibercept vs. ranibizumab/ bevacizumab vs. ranibizumab: P=0.88/ <0.0001/ <0.0001 at 4 weeks; and P=0.11/ 0.09 / 0.001 at 52 weeks. C) Through 104 weeks on original scale. D) Through 104 weeks on log scale. N=87/ 71/ 71 for aflibercept/ bevacizumab/ ranibizumab group. Pairwise comparisons for aflibercept vs. bevacizumab/ aflibercept vs. ranibizumab/ bevacizumab vs. ranibizumab: P=0.90/ <0.0001/ <0.0001 at 4 weeks; P=0.35/ 0.69 / 0.28 at 52 weeks; and P=0.23/ 0.23 / 0.03 at 104 weeks.
