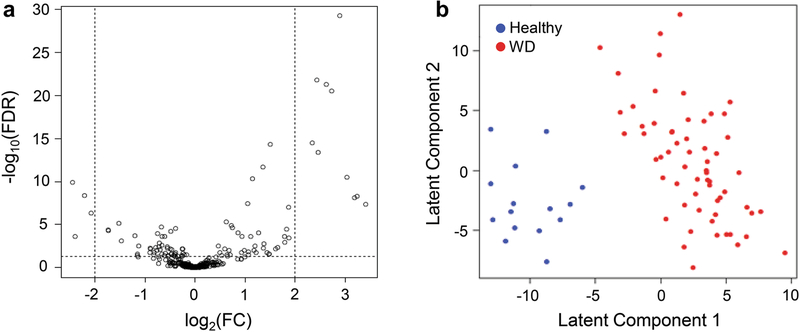
Fig. 1.
Metabolomics profiling analyses for healthy subjects vs. WD patients
1a – Volcano plot of metabolite abundance changes (covariate-adjusted). The x-axis specifies the log2 fold changes and the y-axis specifies the negative logarithm to the base 10 of the FDR values. Dotted vertical and horizontal lines reflect the filtering criteria (log2 FC=±2.0 and FDR=0.05). 1b – Score plots of the PLS-LDA analysis distinguishing WD patients (n=61) from healthy subjects (n=15) based on their metabolomics pattern. WD, Wilson disease; FC, fold change; FDR, false discovery rate, PLS-LDA, partial least-squares regression with linear discriminant analysis

