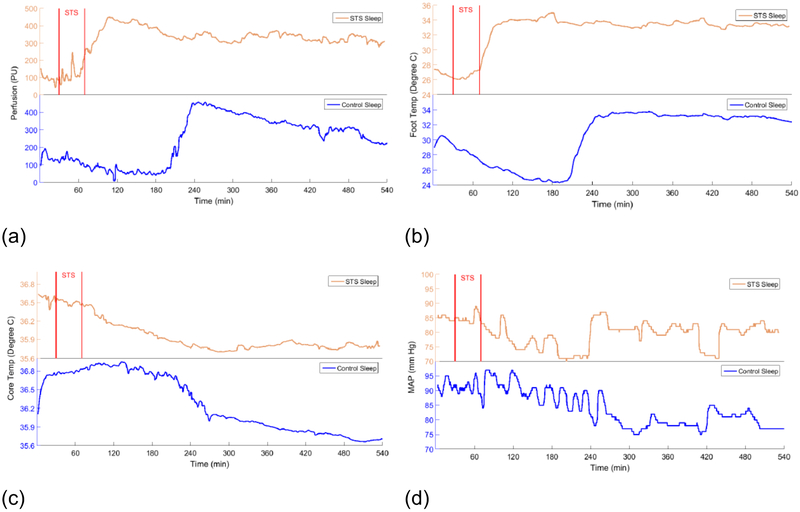
Figure 9.
Overnight physiological data measured on a subject who slept one night without using STS (lower blue plots) and one night with STS applied for 30 minutes at the time of going to bed (upper orange plots). The start and finish of STS are denoted by the vertical lines. (a) Blood flow to glabrous skin of foot measured from an initial 20 min baseline period. (b) Temperature on the foot sole. (c) Core temperature measured with a sublingual probe. (d) Mean arterial blood pressure.

