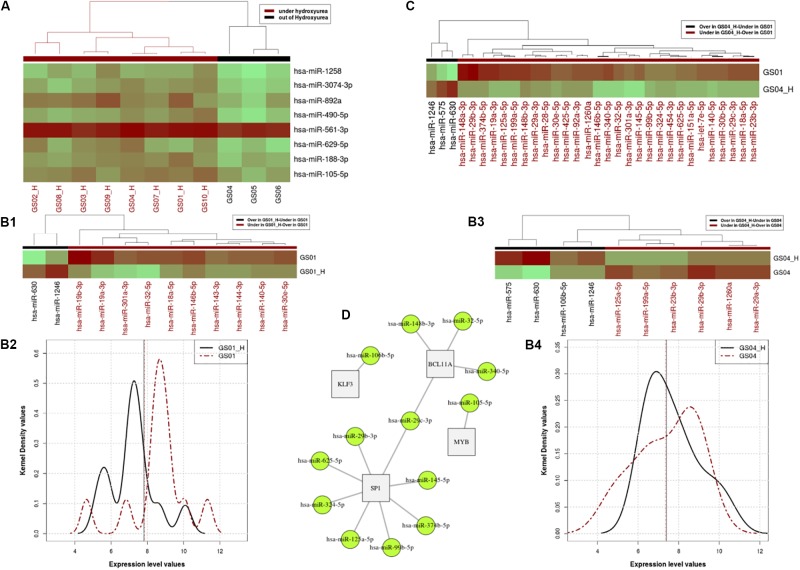
FIGURE 1.
Profiles of Hydroxyurea-induced miRNA expression in selected SCD patients. Panel (A). Heatmap of the miRNA expressing profile for patients that are under HU and off HU in the cross-sectional analysis. Panels (B,C). miRNA expressing profile for patients that are under HU and out of HU, excluding the relapsed patient in pair-wire analysis of patients GS01 and GS04. Using the paired Wilcoxon rank test, we found a significant difference between expression profiles of the two states (p = 0.032e-2), with distinctive micro-RNAs differentially over or expressed in patients GS01 (Panel B1) and GS04 (Panel B3), as shown in the heat map (Panel B2) and the kernel density distributions (Panel B4) plots. Panel (C). miRNA expression levels of 29 miRNA that are over or under-expressed in GS04-HU vs. GS01. Panel (D). Networks linked to over and under expressed miRNA under HU treatment. In the figure 13 miRNAs target mainly 4 genes BCL11A, MYB, KLF3, and SP1, that belong to the same network and influence erythropoiesis and HbF expression.

