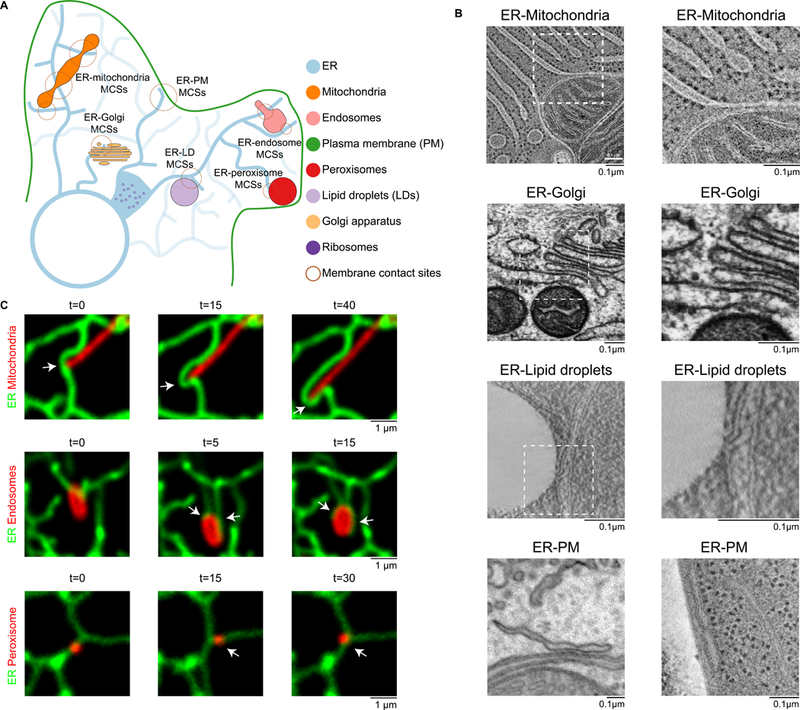
Fig. 1. Visualizing ER membrane contacts sites (MCSs) with other organelles.

(A) Cartoon of the distribution and structure of the ER and the MCSs it forms with other organelles and with the plasma membrane (PM). (B) Electron micrographs of ER MCSs with mitochondria, Golgi, LDs, and the PM. Micrographs of ERmitochondria and ER-Golgi MCSs in rat epithelial cells were provided by M. Ladinsky. Micrographs of ER-LD MCSs in yeast cells were provided by M. Radulovic. ER-PM MCSs in a mouse neuron (left) were imaged by focused ion beam scanning electron microscopy, and the micrograph was provided by Y.Wu and P. De Camilli [adapted from (3)].The micrograph of ER-PM MCSs in yeast (right) was provided byM.West [reproduced from (83) (CCBY-NC-SA 3.0)]. Boxed areas correspond to images on the right. (C) Mitochondria, endosomes and peroxisomes remain tethered to the ER tubules as they traffic. Time-lapse fluorescent images of the ER (green) relative to mitochondria (red, top row), late endosomes (red, middle row), and peroxisomes (red, bottom row) in live COS-7 cells. Arrows denote MCSs. t, time in seconds.
