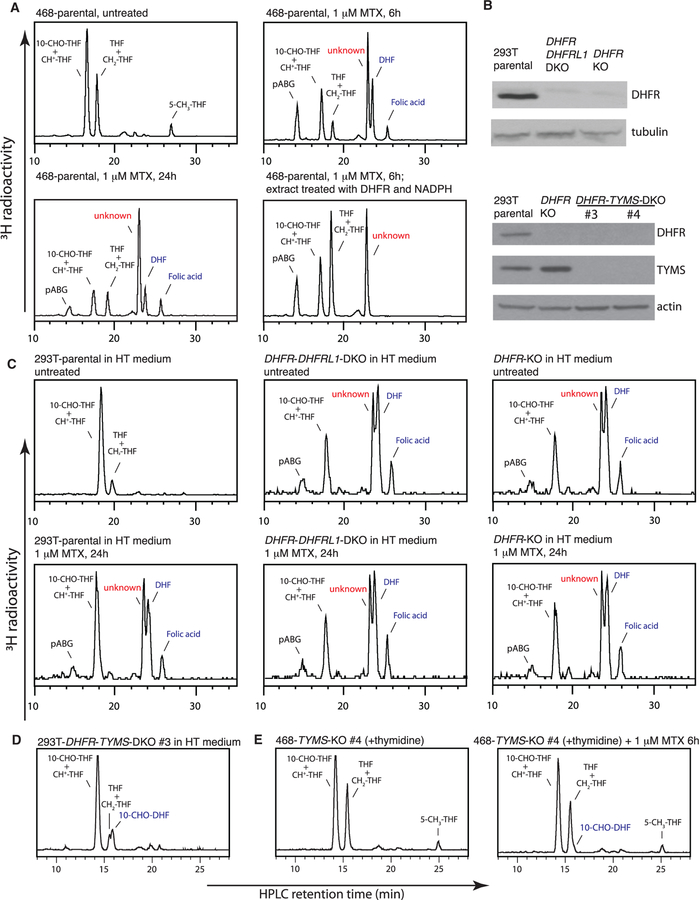
Figure 2. Formation of the Same Unusual Folate Metabolite upon Methotrexate Treatment.
(A) HPLC analysis of folates from MDA-MB-468 cells, untreated or treated with 1 μM methotrexate for indicated times.
(B) Western blot analysis of 293T parental, DHFR-knockout, DHFR-DHFRL1-double-knockout, and DHFR-TYMS-double-knockout cells.
(C) HPLC analysis of folates from 293T parental, DHFR-knockout, DHFR-DHFRL1-double-knockout cells, untreated or treated with 1 μM methotrexate for 24 hr. 100 μM hypoxanthine and 16 μM thymidine (HT) were included in the medium to support cell growth.
(D) HPLC analysis of folates from 293T DHFR-TYMS-double-knockout cells.
(E) HPLC analysis of folates from MDA-MB-468 TYMS-knockout cells, untreated or treated with 1 μM methotrexate for 6 hr. 16 μM thymidine was included in the medium to support cell growth.
See also Figure S2.

