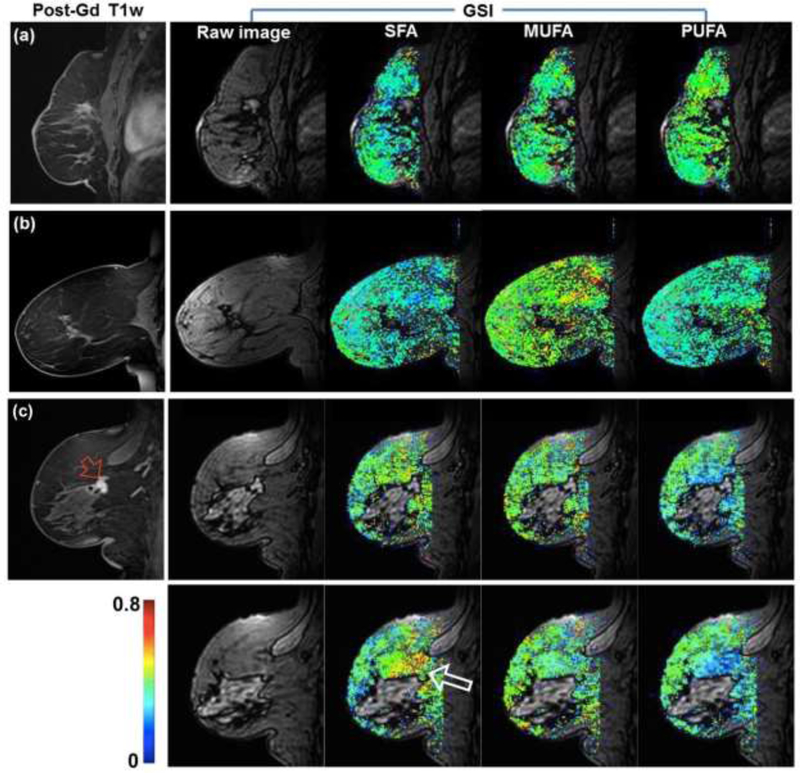
Figure 4.
Representative examples of fatty acid maps along with the raw images at first echo time of the GSI and post-Gd T1 weighted image. (a) A 66-year-old woman with post-surgical change. (b) A 59-year-old woman without any suspicious lesion. (c) A 67-year-old woman with newly diagnosed invasive ductal carcinoma (red arrow). The larger arrow (white) on the saturated fatty acid (SFA) map indicates higher level of SFA close to the lesion.

