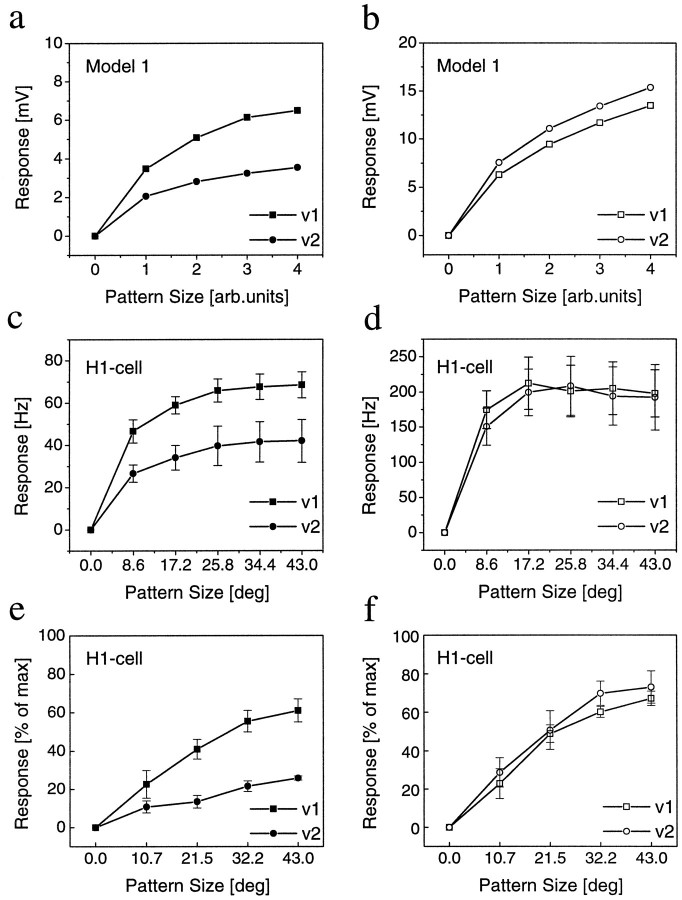
Fig. 3.
Gain control in model cell and real fly cell before and after blockade of inhibition. a, b, For the LPTC model, we used identical membrane parameters as in Figure 1. Inputs were driven by weak directional EMDs (Fig. 1b, Model 1). When stimulated by patterns of increasing size at two different velocities, the axonal membrane potential saturates at different levels (gain control). After blocking the inhibitory inputs, both velocities yield similar responses. c–f,Extracellular recordings of spiking LPTCs (H1-cells) before (c, e) and after (d, f) PTX application, using two different image velocities (v1 = 72 °/sec; v2 = 360 °/sec). c, In normal fly saline, the response increases with increasing stimulus size and saturates for each stimulus velocity at a different response level (gain control). d, After PTX application, the response increases significantly but now saturates at the same level for both velocities. Data represent the mean ± SEM of recordings from four different animals. e, f, Same experiment as inc, d, but using low-contrast gratings this time. A high-contrast stimulus with full pattern size was additionally used to determine a maximum spike frequency of each cell. All responses are expressed as percentage of this value. After PTX application, the cells respond at about the same level to both velocities. However, the responses to v2 now is slightly stronger than to v1 (compare with simulation results in a, b). Data represent the mean ± SEM of recordings from four different animals.

