Fig. 2.
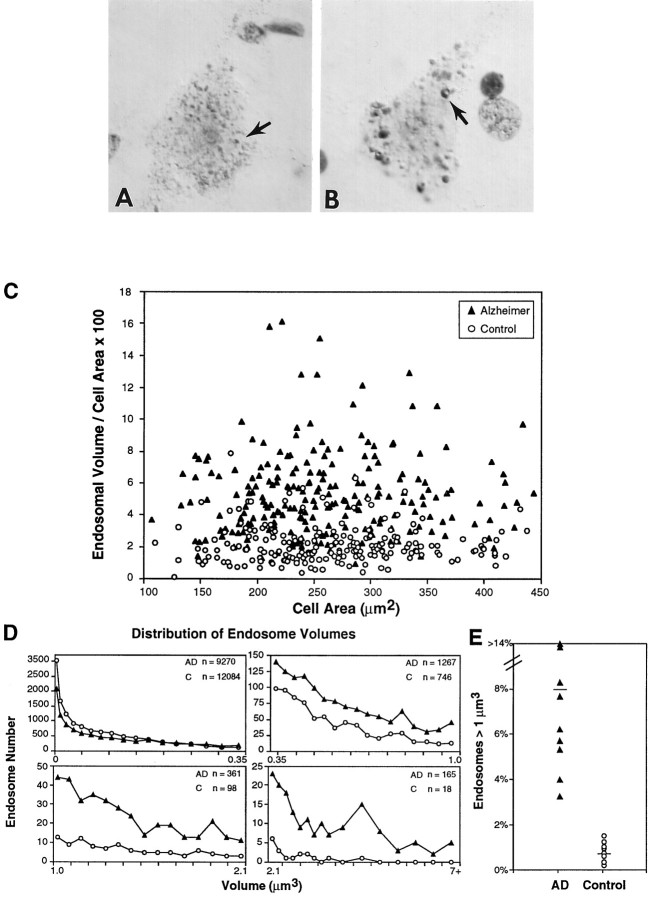
Morphometric analysis of rab5-positive early endosomes in control and Alzheimer’s disease (AD) brains. High-magnification images of early endosomal compartments (arrows) in neocortical neurons in lamina III of aged control (A) and AD (B) brains immunostained with rab5 and enhanced by Nomarski optics show the striking increase in the size of these compartments in AD brain, as compared with control. In some, invaginations suggest a location at the plasmalemma. C, Percentage of cell area occupied by rab5-positive early endosomes plotted as a function of total cell area. Alterations in early endosomes were widespread in AD brains, and many pyramidal neurons in AD brains (filled triangles) exhibited a significant increase (>2 SD higher than the control mean) in total endosomal volume per cross-sectional cell area as compared with age-matched controls (open circles) (AD mean = 5.37% ± 0.19; control mean = 2.18% ± 0.09). D, The size distributions of individual early endosomes present in 25 lamina III pyramids from each of eight aged control and nine AD brains show that a substantial proportion of individual neuronal endosomes in the AD brains had volumes larger than those in control brains. Endosomal volume is expressed as a function of cell area for easier visualization of data. E, The percentage of abnormally large endosomal profiles that are >1 μm3. Values are mean percentage based on 25 pyramidal neurons per individual brain (n = 9 AD and 8 controls). Approximately 10-fold higher numbers are seen in AD brains as compared with controls (AD mean = 7.8% ± 1.65; control mean = 0.80% ± 0.13). Changes in endosomal volume as a function of cell area were not significant in AD and control brains. Magnification inA, B, 4700×.

