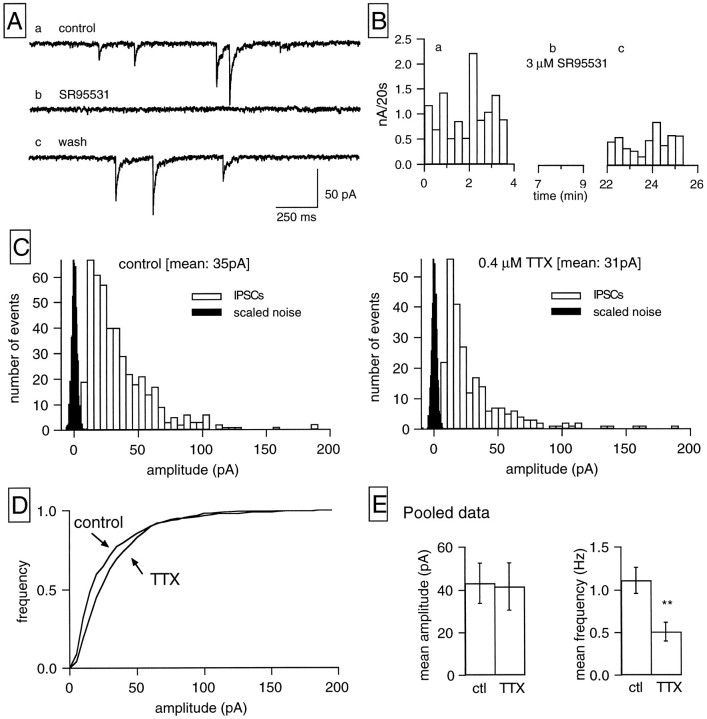
Fig. 1.
GABAergic IPSCs in RGCs. A, Selected traces from a continuous current recording obtained in symmetrical Cl− conditions. Holding potential, −60 mV. The inward current transients present in a, corresponding to IPSCs, are reversibly blocked by bath application of 3 μm SR95531 (b), a blocker of GABAA receptors. B, Plot of the sum of the amplitudes of all synaptic events detected during 20 sec intervals against time for the cell shown in A in control saline (a), in the presence of 3 μm SR95531 (b), and after removal of the antagonist (c). In this and subsequent figures presenting plots of synaptic activity per unit of time, the gaps in the time axes correspond to periods in which data acquisition was interrupted, allowing for complete equilibration of the drug tested (see Materials and Methods). C, Amplitude distributions of the IPSCs recorded at −60 mV in control condition (left) and in the presence of 0.4 μm TTX (right). The corresponding scaled noise distributions (1000 events each) are displayed in black; bin widths: 5 pA for the IPSCs, 0.5 pA for the scaled noise histogram. The total sampling time was the same for both IPSC histograms (4 min). TTX decreased IPSC frequency without affecting their mean amplitude; the mean IPSC amplitude is 35 pA in the control histogram (450 events, corresponding to a frequency of 1.87 Hz) and 31 pA in the TTX histogram (244 events, corresponding to a frequency of 1.02 Hz). D, The cumulative amplitude distributions for the same experiment are displayed. E, Data pooled from 11 cells on the effects of TTX on mean amplitude (left) and mean frequency (right) of GABAergic IPSCs recorded at −60 mV. The vertical linescorrespond to the SEM; asterisks indicate that the two groups are statistically different at the 0.001 level (Student’st test).

