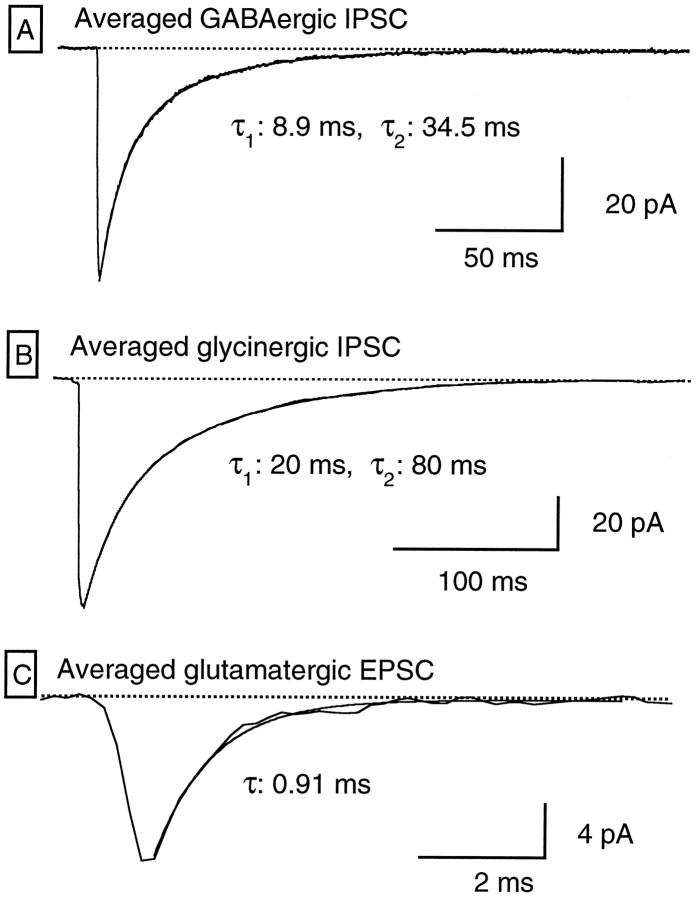
Fig. 4.
Comparative kinetics of GABAergic IPSCs, glycinergic IPSCs, and glutamatergic EPSCs. A, Average of 73 GABAergic IPSCs. Only those IPSCs separated from other IPSCs by >150 msec were included in the average. The decay phase was fit by the sum of two exponential functions with time constants of 8.9 and 34.5 msec (amplitude coefficients of −36 and −24.5 pA, respectively); the fit is superimposed on the averaged trace. B, Average of 182 glycinergic IPSCs. Only those IPSCs separated from other IPSCs by >500 msec were included in the average. The decay phase was approximated by a double-exponential function with time constants of 17.6 and 79.6 msec (amplitude coefficients, −41 and −49 pA, respectively). The fit is superimposed on the averaged trace.C, Average of 33 glutamatergic EPSCs. Superimposed on the trace is the fit of the decay phase by a single exponential with a time constant of 0.91 msec. These fast EPSCs were abolished by CNQX (10 μm; data not shown).

