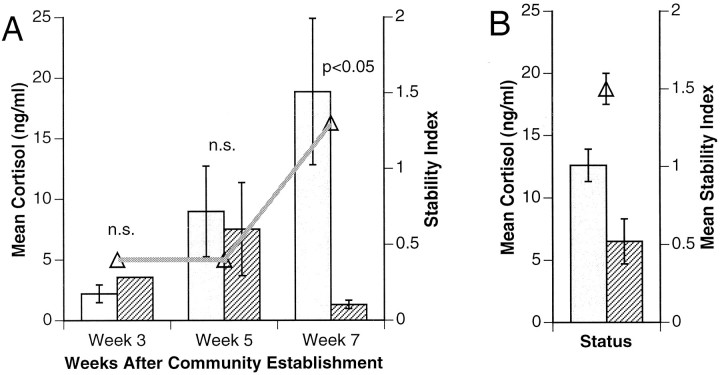
Fig. 4.
Cortisol levels of NTs (open bars) and Ts (striped bars) shown for (A) low-density communities and (B) high-density communities (averaged). In both cases, the stability index (Δ) (see Materials and Methods) is superimposed on cortisol level data. In the low-density setting, differences in cortisol levels are plotted over the course of 7 weeks. High-density communities had been established for 2 months before blood sampling and are fully stabilized.

