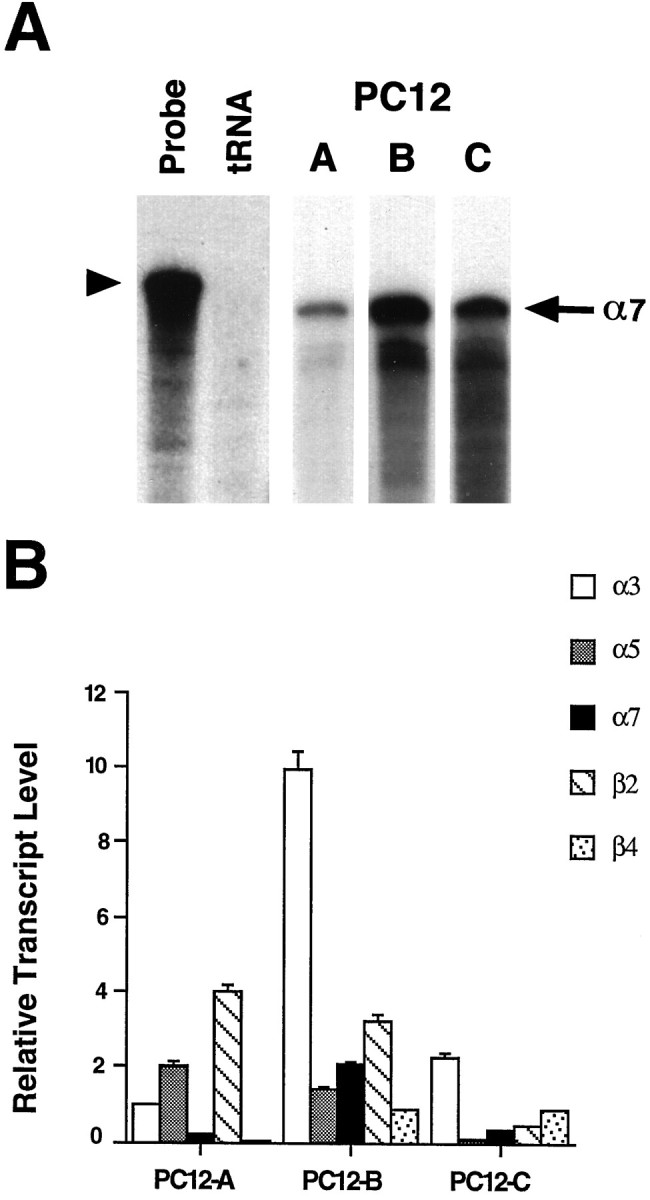
Fig. 3.

Relative amounts of AChR gene transcripts in three PC12 populations. RNase protection assays were used to measure the levels of α3, α5, α7, β2, and β4 transcripts in PC12-A–PC12-C cells. A, Representative RNase protection autoradiogram in which 20 μg samples of total RNA were hybridized with a 32P-labeled α7 riboprobe (Probe lane, arrowhead). tRNA (15 μg) served as a negative control; neither it nor probe alone protected a radiolabeled species (tRNA lane). Each PC12 RNA sample protected an α7 band of the expected size (arrow); the levels of α7 mRNA varied among the three cell populations, with the PC12-B cells expressing the most. B, The protected species obtained with each of the five probes was quantified on a Bio-Rad Molecular Imager. The results represent the mean ± SEM for three to seven determinations from a total of three or four RNA preparations and are normalized to the signal obtained for α3 transcript in PC12-A cells.
