
Fig. 4.
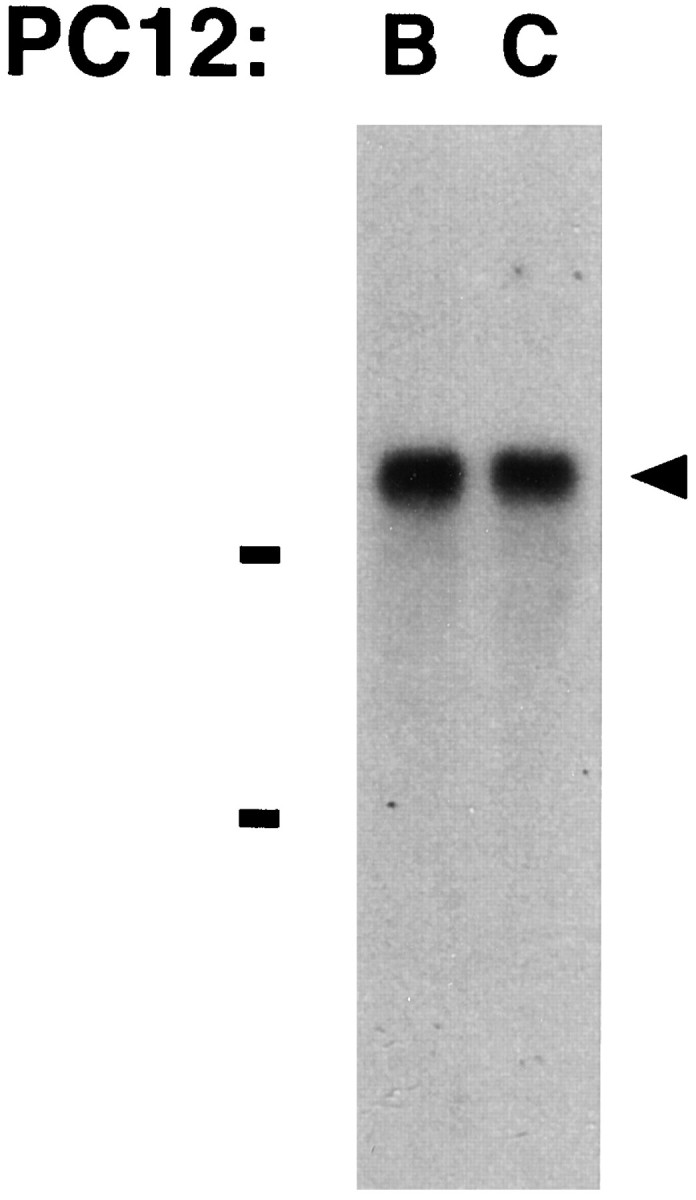
Northern blot analysis demonstrating α7 transcripts of equivalent size in PC12-B and PC12-C cells. Total RNA was isolated from each population and subjected to electrophoresis on a formaldehyde–agarose gel followed by capillary blotting onto a nylon membrane. The blot was hybridized with random-primed,32P-labeled probe directed to the cytoplasmic domain of α7. Bars indicate the 28 and 18 S ribosomal RNAs. Both populations express a single α7 transcript ∼6.4 kb in length (arrowhead). The results are qualitative with respect to band intensity and should not be used to assess relative abundance of the transcripts. Similar results were obtained in four other experiments.