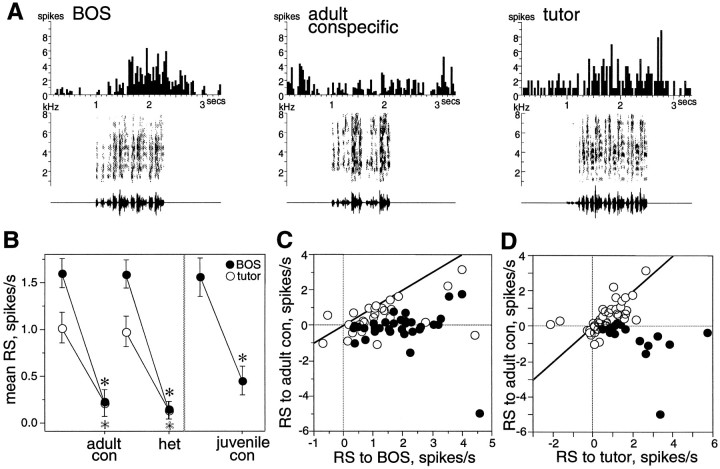
Fig. 2.
Song selectivity of LMAN neurons at 60 d.A, Peristimulus time histograms show the cumulative response of a single LMAN neuron to multiple trials of song stimuli. This neuron responded strongly to BOS and tutor song and less to an adult conspecific song. Below each histogram, the sonogram (frequency vs time plot, with the energy in each frequency band indicated by degree of darkness) and oscillogram (amplitude waveform vs time plot) of the song are shown. B, Mean RS values from all LMAN neurons are shown for several stimulus types. Error bars indicate SEM. Paired comparisons show that mean RS to BOS (black circles) and tutor song (white circles) are greater than those to adult conspecific (adult con), heterospecific (het), and juvenile conspecific (juvenile con). Asterisks mark significant differences (black for BOS comparisons,white for tutor comparisons). C, The mean RS to BOS of each LMAN neuron is plotted against its mean RS to adult conspecific song (adult con). The diagonal line marks where cells lie if they respond equally to both stimuli; black circles indicate cells with significantly greater responses to the stimulus depicted on theabscissa (p < 0.05, unpairedt test between abscissa stimulus trials and all adult conspecific trials). D, The mean RS to tutor song of each neuron is plotted against its mean RS to adult conspecific song. Conventions are as in C.

