Fig. 8.
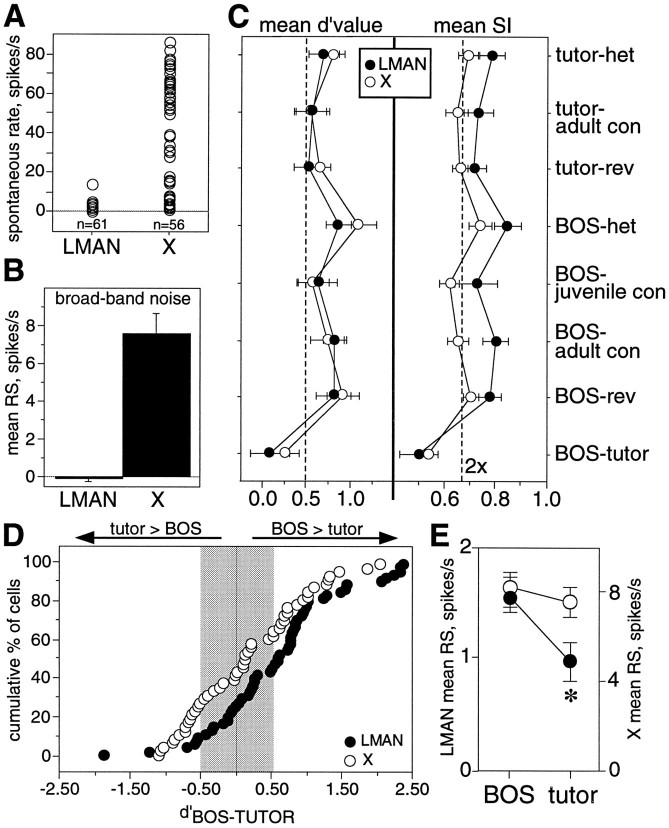
Comparisons of LMAN and X properties.A, Mean spontaneous firing rates for each LMAN and X neuron recorded. B, A histogram compares the mean RS of all LMAN neurons to a 300 msec broad band noise burst with that of all X neurons. C, Mean d′ value (left graph) and mean SI (right graph) for each selectivity category are shown for LMAN (black circles) and X (white circles). Error bars indicate SEM. Means were calculated from the average SI or d′ value of each nucleus from each bird. The dotted line at0.5 in the left graph marks the criterion value for a selective response. In the right graph, means plotted to the right of the dotted line (2×) denote average responses to the preferred stimulus that were at least two times greater than average responses to the nonpreferred stimulus. Abbreviations are defined in legends to Figures 6 and 7.D, The cumulative distribution ofd′BOS-TUTOR values is shown for neurons in LMAN (black circles) and X (white circles). E, The mean RS of each nucleus to BOS and tutor song is shown; the left axis corresponds to LMAN values (black circles), and the right axis corresponds to X values (white circles). Error bars indicate SEM. The difference in RS between BOS and tutor song was significant for LMAN only (black asterisk).

