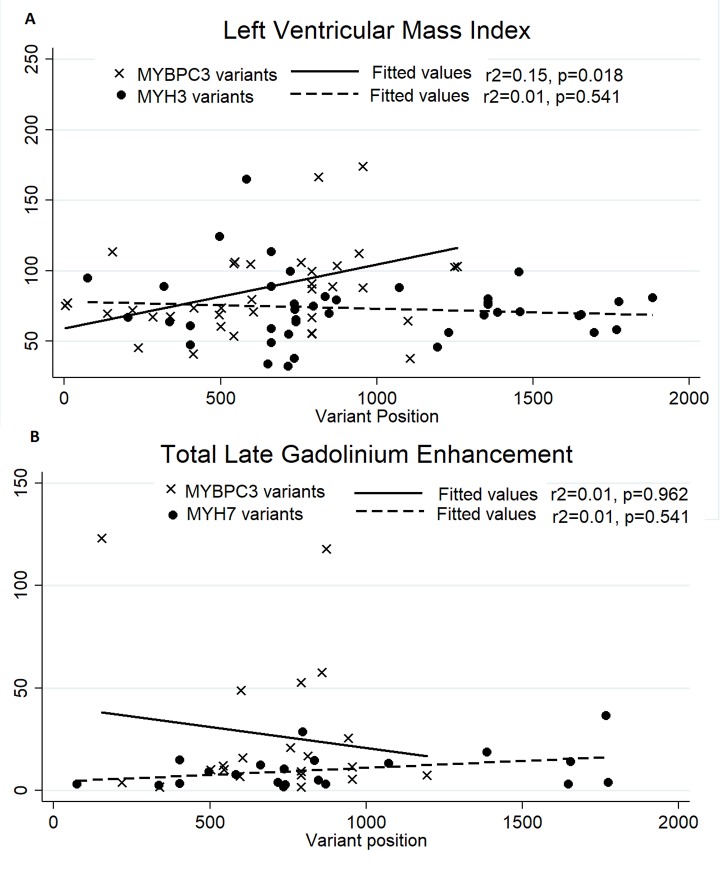
Fig 2. Correlation between variant position and phenotype.
Panel A shows the correlation between variant position and left ventricular mass index. Variant position was associated with LVMI in MYBPC3 variants (p = 0.018). Panel B shows the lack of correlation between variant position of total late gadolinium enhancement.

