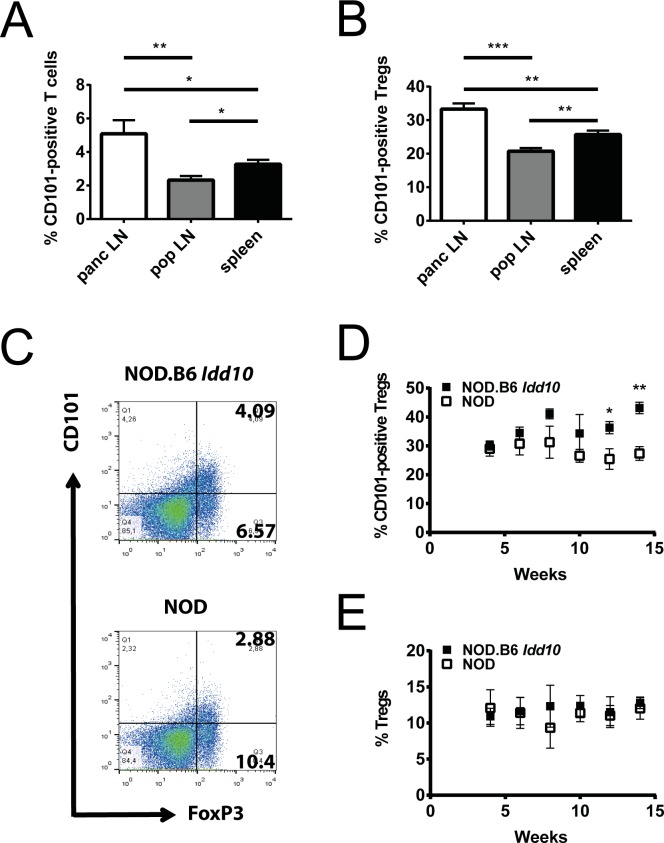
Fig 1. CD101-positive T cells accumulate in the pancreatic lymph nodes of NOD.B6 Idd10 mice.
The expression of CD101 on TCRβ-positive T cells (A) and FoxP3-positive Tregs (B-E) was assessed by flow cytometry in the spleens (A, B), pancreatic (panc) (A-E) and popliteal (pop) (A, B) lymph nodes. The compiled data of five individual 4-8-week-old NOD.B6 Idd10 mice (A, B) are displayed. Representative FACS plots are shown in S2 Fig. The expression of FoxP3 and CD101 was assessed on T lymphocytes expressing the β-chain of the TCR and CD4 (C-E). Representative FACS plots for NOD.B6 Idd10 (upper panel) and NOD (lower panel) mice are displayed (C). The percentage of CD101-expressing Tregs (D) as well as the percentage of FoxP3-positive Tregs (E) was compiled of 4 (week 4, 10, 12 and 14 of age) or 5 (week 6 and 8) individual mice per time point. Comparisons between groups were performed using the Mann–Whitney nonparametric test (*, p<0.05; **, p<0.01; ***, p<0.001). Error bars indicate the SD of the mean.

