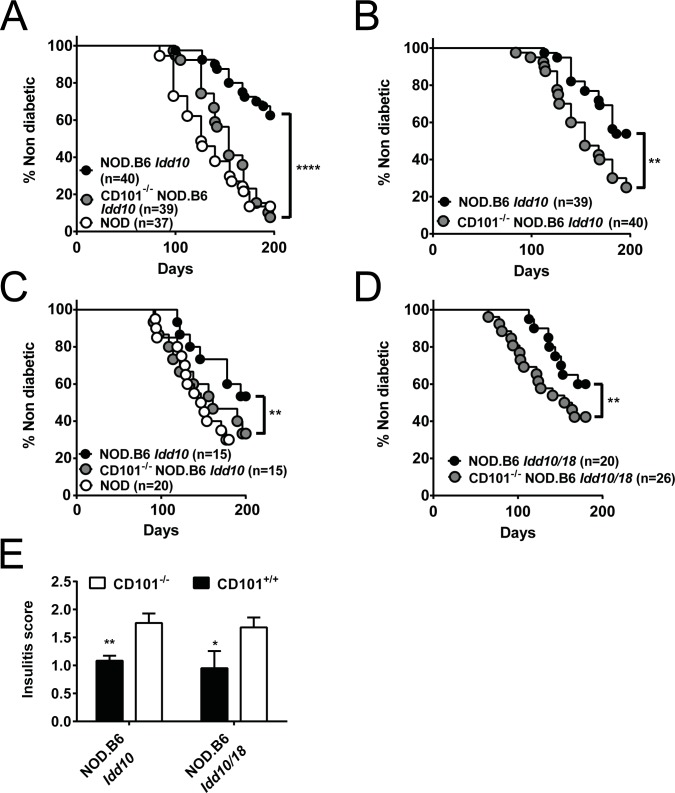
Fig 3. CD101-expression protects NOD.B6 Idd10 and NOD.B6 Idd10/18 mice from T1D.
The frequency of T1D was assessed by the analysis of urinary glucose concentration (A-D) and histopathologic lesions (E) in the indicated number of females in parental NOD mice, CD101+/+ NOD.B6 Idd10 mice and CD101−/− NOD.B6 Idd10 mice (A-C) as well as in CD101+/+ NOD.B6 Idd10/18 mice and CD101−/− NOD.B6 Idd10/18 mice (D). Mice were derived from homozygous breeders except in the case of mice shown in (B) where progeny of heterozygous breeders were monitored for T1D. T1D incidence was assessed at Taconic (A+B, performed contemporaneously so the NOD control group shown in A is also the NOD control group for the groups of mice shown in B) and at CCHMC (C+D, performed contemporaneously so the NOD control group shown in C is also the NOD control group for the groups of mice shown in D). Histopathologic analysis of pancreata was performed in nondiabetic 8–10 week-old CD101−/− NOD.B6 Idd10 (n = 5), CD101+/+ NOD.B6 Idd10 (n = 6), CD101−/− NOD.B6 Idd10/Idd18 (n = 5) and CD101+/+ NOD.B6 Idd10/Idd18 (n = 4) female mice (E). For T1D frequency comparisons Kaplan–Meier survival curves were plotted for each mouse strain, and statistical significance was determined by log rank test (*, p<0.05; **, p<0.01; ****, p<0.0001). For insulitis comparisons a one-tailed t-text was used (*, p<0.05; **, p<0.01). Error bars indicate the SD of the mean.

