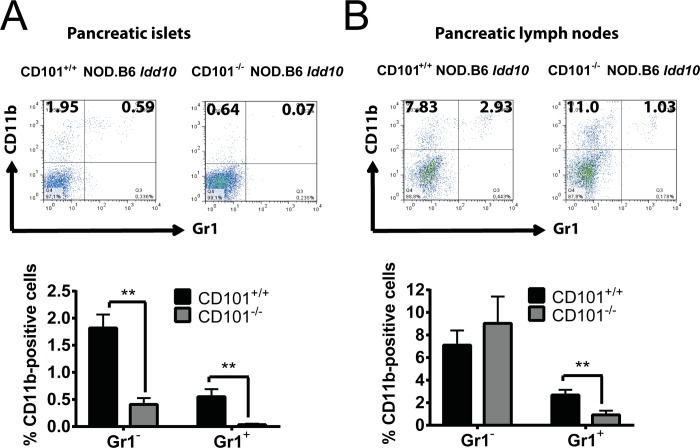
Fig 5. Gr1-expressing myeloid cells accumulate in the pancreatic lesions of CD101+/+ NOD.B6 Idd10 mice.
Representative FACS dot plots of Gr1- and/or CD11b-expressing myeloid cells from the pancreas (A) and the pancreatic lymph nodes (B) of 14-week-old CD101+/+ and CD101−/− NOD.B6 Idd10 mice are displayed (upper panels). The percentages of Gr1-positive and Gr1-negative cells among CD11b-expressing myeloid cells were compiled from 8 individual CD101−/− NOD.B6 Idd10 and CD101+/+ NOD.B6 Idd10 mice (A+B, lower panels). Statistical significance was determined using Mann-Whitney tests (*, p<0.05; **, p<0.01; ***, p<0.001). Error bars indicate the SD of the mean.

