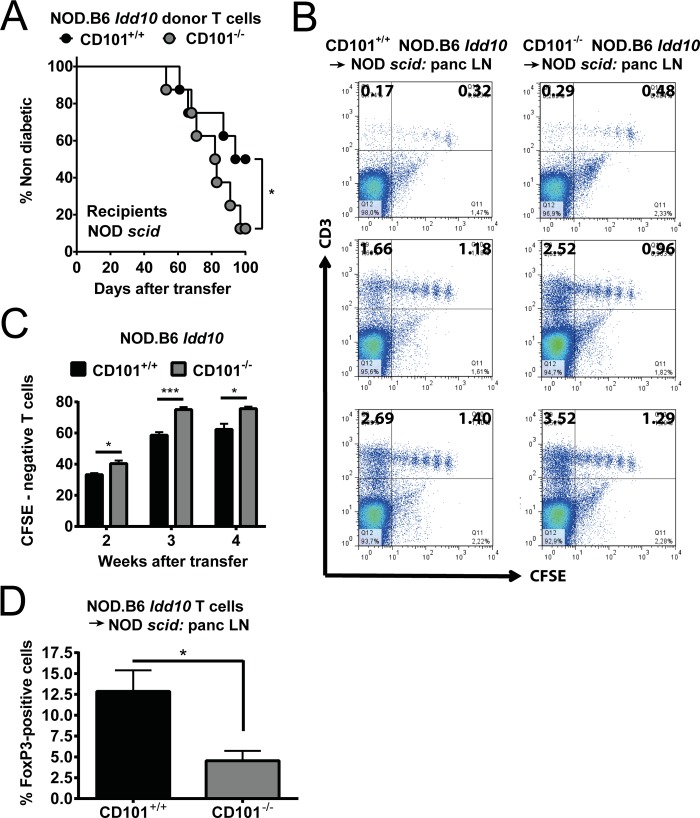
Fig 6. Protection from T1D is associated with a restriction of T cell expansion and an accumulation of Tregs.
The frequency of T1D was assessed by the analysis of urinary glucose concentration (A) in NOD scid recipients upon transfer of 5x10⁷ T cells from 6-8-week-old CD101+/+ NOD.B6 Idd10 or CD101−/− NOD.B6 Idd10 mice. 16 female recipients in each cohort were analyzed until day 100 after the adoptive T cell transfer. Kaplan–Meier survival curves were plotted for each mouse strain, and statistical significance was determined by log rank test (*, p<0.05). CD101 restricts the expansion of adoptively transferred T cells (B+C). T cells from CD101+/+ NOD.B6 Idd10 and CD101−/− NOD.B6 Idd10 donors were CFSE-labelled and transferred into NOD scid recipients. 2 (upper panels), 3 (middle panels) and 4 weeks (lower panels) after transfer the division of T cells in the pancreatic lymph nodes was assessed by the analysis of CFSE dilution. The percentages of CFSE-negative cells reflecting the upper left gates in panel B were determined from all CD3-positive T lymphocytes and compared between recipient mice of CD101+/+ or CD101−/− donors (C). Representative FACS dot plots (B) and summaries (C) of donor T cells obtained from the pancreatic lymph nodes of 3–5 NOD scid recipients are displayed. All cells were pre-gated on CD45. Tregs are reduced in the pancreatic lymph nodes of NOD scid recipients of CD101−/− as compared to CD101+/+ NOD.B6 Idd10 T cells (D). The percentage of FoxP3+ cells in total CD4 T cells are shown (n = 5 in each cohort). To assess statistical significance a one-tailed t-text was used (*, p<0.05; **, p<0.01).

