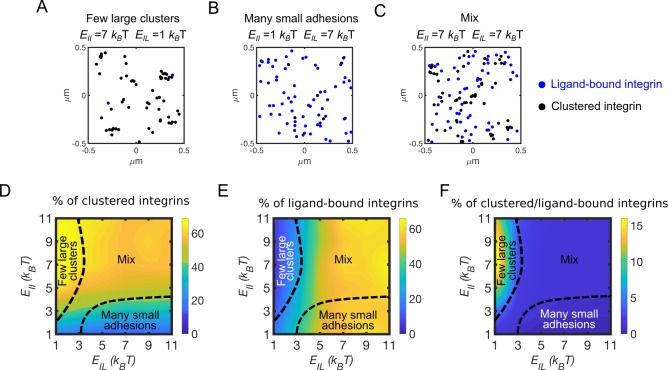
Fig 3. Integrin affinity and avidity determine clustering and ligand binding.
(A) Configuration of clustered integrins (black circles) and ligand-bound integrins (blue circles) at a time point between 80–100 s of simulations, using EII = 7 kBT and EIL = 1 kBT. (B) Configuration of clustered integrins (black circles) and ligand-bound integrins (blue circles) at a time point between 80–100 s of simulations, using EII = 1 kBT and EIL = 7 kBT. (C) Configuration of clustered integrins (black circles) and ligand-bound integrins (blue circles) at a time point between 80–100 s of simulations, using EII = 7 kBT and EIL = 7 kBT. (D) Average percentage of clustered integrins relative to total integrins, by varying EIL and EII. (E) Average percentage of ligand-bound integrins relative to total integrins, by varying EIL and EII. (F) Fraction between clustered and ligand-bound integrins, by varying EIL and EII. This indicates the amount of clustered integrins per ligand-bound integrin. All data are computed between 100–130 s of simulations, from four independent runs.

