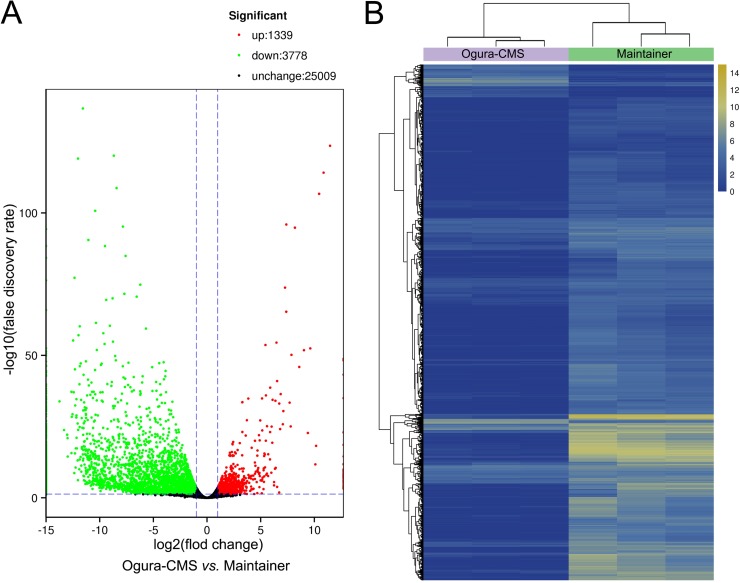
Fig 7. Expression profiles of differentially expressed genes (DEGs) in the Ogura-CMS and its maintainer fertile (MF) inflorescences of turnip.
(A) Volcano plot showing significantly DEGs with log2 fold change (FC) ≥ 1 or ≤ -1 (Benjamini-Hochberg false discovery rate < 0.05). (B) A hierarchical clustering graph based on the expression values of all significantly DEGs identified in (A).

