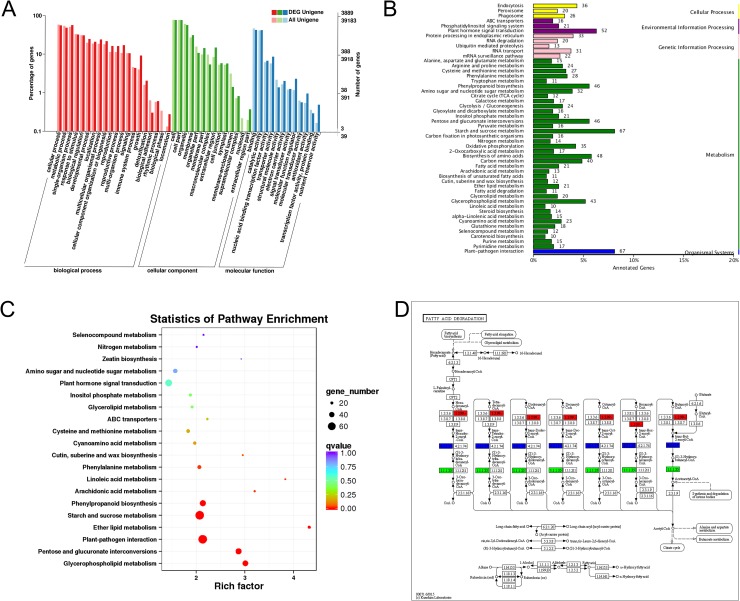
Fig 8. Gene Ontology (GO) and Kyoto Encyclopedia of Genes and Genomes (KEGG) pathway analyses.
(A) GO annotations of all unigenes and differential expressed genes (DEGs) in the Ogura-CMS and its maintainer fertile (MF) inflorescences of turnip. The results are summarized in three main categories: biological process, cellular component and molecular function. The y-axis on the right indicates the number of genes in a category. The x-axis on the left indicates the percentage of a specific category of genes in that main category. (B) KEGG pathway annotations of DEGs. (C) KEGG pathway enrichment analysis of DEGs with top 20 enrichment scores. (D) KEGG pathway annotations of the fatty acid degradation pathway. Red marked nodes are associated with up-regulated genes; green nodes are associated with down-regulated genes; blue nodes are associated with both up-regulated and down-regulated genes.

