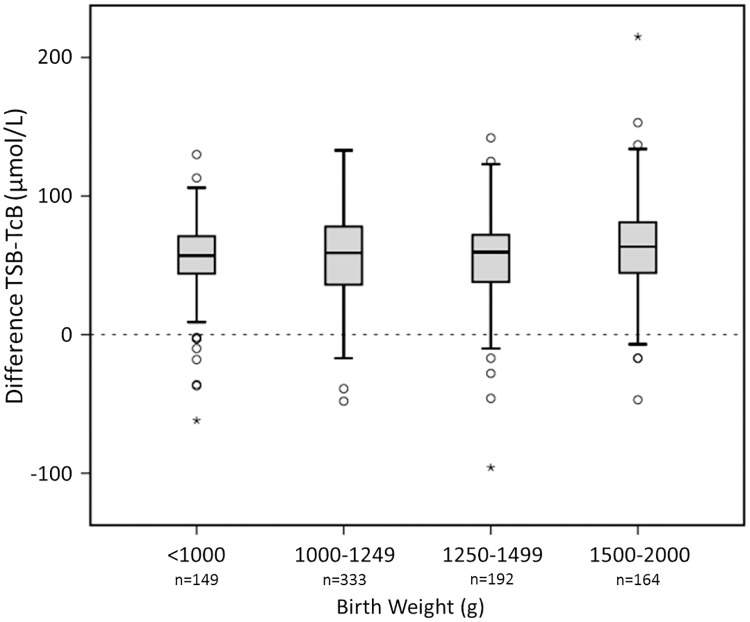
Fig 3. Birth weight categories and the mean difference between TSB and TcB.
The y–axis displays the mean difference between TSB and TcB in μmol/L. TSB, total serum bilirubin in μmol/L; TcB, transcutaneous bilirubin in μmol/L; 17.1μmol/L = 1 mg/dL bilirubin. The median is marked by the horizontal line in the central box. The boxes are limited by the 25th and 75th percentiles. The whiskers (┴) represent the minimum and maximum TSB and TcB levels. Outliers (○) and extremes (star symbol) are depicted separately. The dashed line is the line at origin.

