Figure 3.
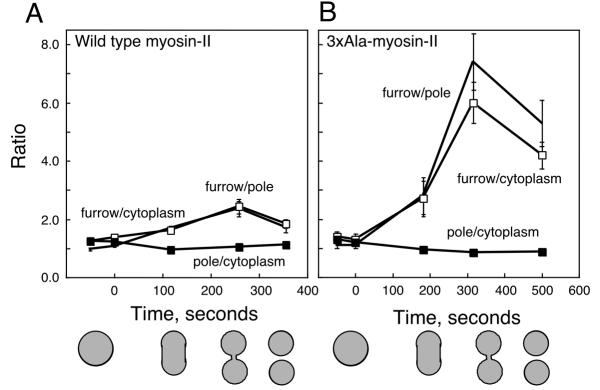
The relative intensity ratios for the pole cortex, furrow cortex and cytoplasm were measured as a function of time. Zero seconds indicates the point of nuclear division. A. The graph shows the ratios obtained with wild-type GFP-myosin-II. The shapes of the cells at four different time points are indicated by the cartoons. B. This graph shows the ratios obtained with cells expressing 3 × Ala GFP-myosin-II. Standard errors for each time point are based on n≥ 4. Markers: furrow-to-pole, no marker; furrow-to-cytoplasm, open square; pole-to-cytoplasm, closed square. The same markers are used for both plots.

