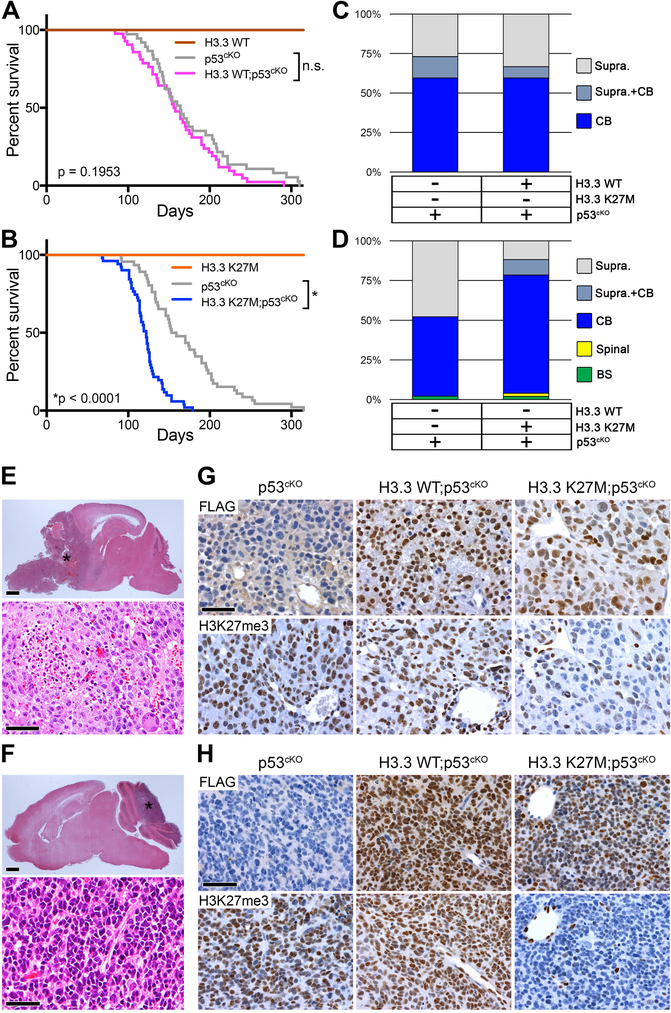
Figure 2. H3.3 K27M Accelerates Medulloblastoma Formation Caused by Trp53-Deficiency.
(A) Kaplan-Meier survival analysis in mice with induced H3.3 WT (n = 4), p53cKO (n = 37; gray), or H3.3 WT;p53cKO (n = 42), ns, p = 0.195. (B) Kaplan-Meier survival analysis with induced H3.3 K27M (n = 5), p53cKO (n = 46), or H3.3 K27M;p53cKO (n = 51), *p < 0.0001. Cohorts in A and B bred separately and used littermate controls to compare survival and tumor spectrum. (C,D) Location of macroscopic brain tumors in cohorts shown in the panel A (C) and the panel B (D). Supra, Supratentorial; CB, Cerebellar; Spinal, Spinal cord; BS, Brainstem. (E,F) H&E stain of representative supratentorial HGG (E) or medulloblastoma (F) observed in all genotypes. *in upper images indicates tumor. Scale bar = 1 mm (top images), 50 μm (bottom images). (G,H) Expression of FLAG-tagged H3.3 (upper images) and H3K27me3 (lower images) is shown by IHC on sections of representative supratentorial HGG (G) or medulloblastoma (H) for the indicated genotypes. Scale bar = 50 μm.

