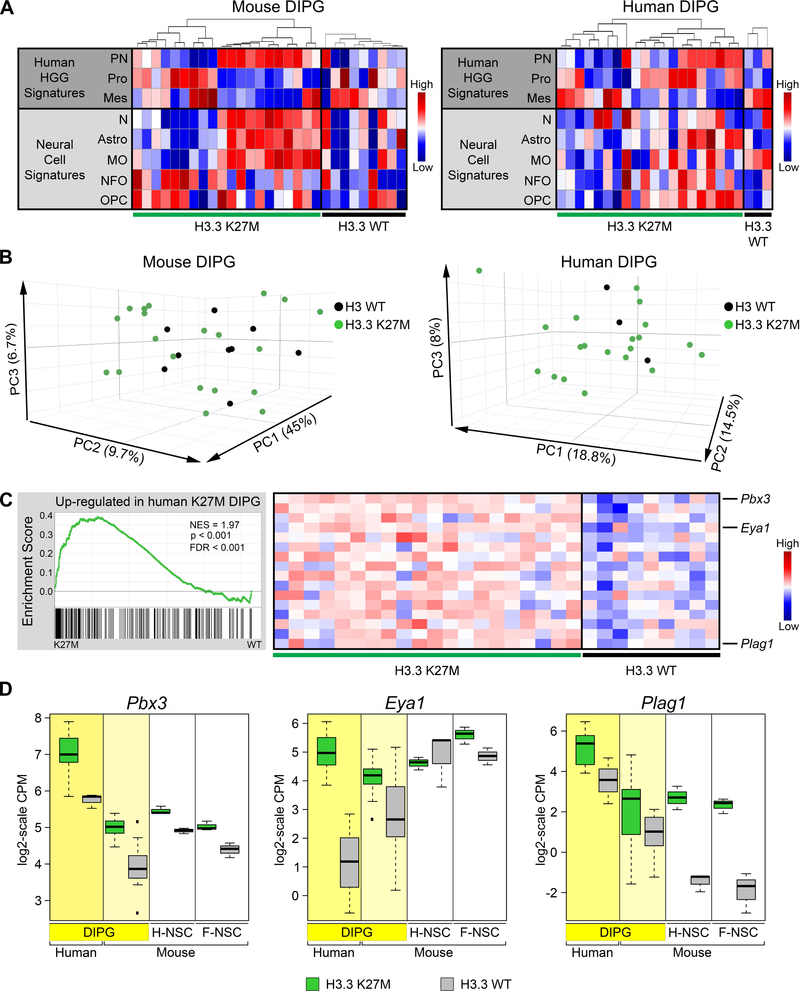
Figure 5. Gene Expression in Mouse H3.3 K27M DIPGs Significantly Resembles That in Human H3.3 K27M DIPG.
(A) Heatmaps of ssGSEA scores comparing signatures for human HGG subgroups (PN, proneural; Pro, Proliferative; Mes, Mesenchymal) and normal murine neural cell types (N, Neurons; Astro, Astrocytes; MO, Myelinating oligodendrocytes; NFO, Newly formed oligodendrocytes; OPC, Oligodendrocyte precursor cells) between spontaneous mouse DIPG expressing H3.3 K27M (n = 20) or H3.3 WT (n = 9) or primary human DIPGs with H3.3 K27M (n = 20) or H3 WT (n = 3). For each panel, tumors were first separated by genotype then ordered by hierarchical clustering of gene signatures from human HGG subgroups. (B) PCAs of mouse and human DIPGs in (A). (C) GSEA showing significant enrichment in H3.3 K27M mouse DIPGs of genes upregulated in H3.3 K27M compared with H3.3 WT human DIPGs. Running enrichment score plots (left) and gene expression heatmaps in mouse H3.3 K27M or H3.3 WT DIPGs showing top leading edge genes (right). (D) Expression of leading edge upregulated genes Pbx3, Eya1 and Plag1. Boxplots depict log2-scale RNA-seq CPM values for primary human and mouse DIPGs, and mouse hindbrain (H-NSC) and forebrain (F-NSC) NSCs expressing H3.3 K27M or H3.3 WT. Box plots show the interquartile range (IQR). Median is shown as a horizontal line, highest and lowest values up to 1.5 times the IQR are shown with dotted lines outside box, and outliers greater than 1.5 times the IQR are shown as black squares. See also Figures S5 and S6 and Tables S4 and S5.

