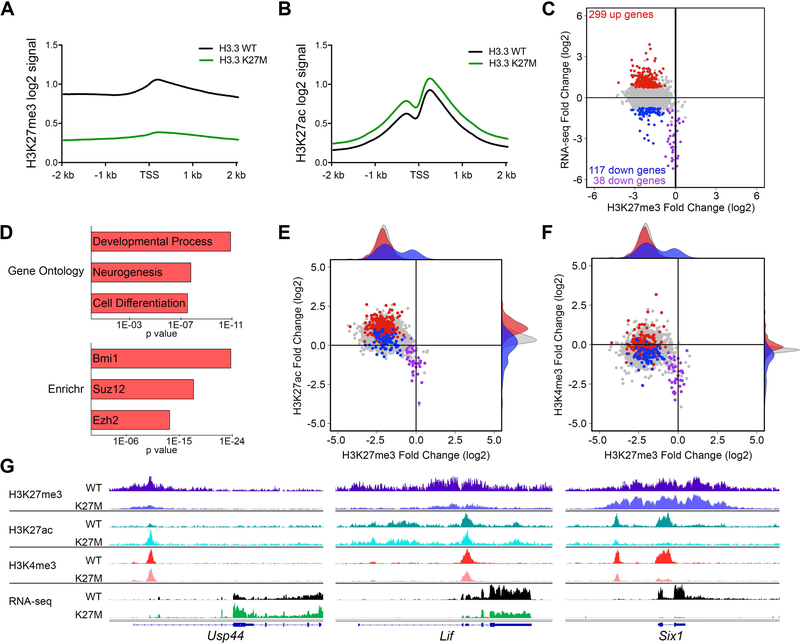
Figure 6. Spontaneous H3.3 K27M DIPGs Exhibit Global Changes in H3K27 Epigenetic State and Selective Expression Changes in PRC1 and PRC2 Targets.
(A,B) Promoter based histograms representing counts within 40 bp bins across 4 kb region centered at TSS for H3K27me3 (A) or H3K27ac (B) in H3.3 K27M (n = 6) and H3.3 WT (n = 5) mouse DIPGs. (C) Plot of H3.3 K27M/H3.3 WT log2 ratio in mouse DIPGs for promoter regions comparing RNA-seq versus H3K27me3. Colored data points depict genes up (red) and downregulated (blue and purple) in H3.3 K27M tumors, with p < 0.05 and a log2 fold change greater than 0.75 or less than −0.75, respectively, compared to the gene loci bulk (gray). Purple data points show downregulated genes with H3K27me3 log2 fold change of −0.75 or greater (relative H3K27me3 retention). RNA-seq: H3.3 WT, n = 9; H3.3 K27M, n = 20. (D) Gene ontology and Enrichr ChEA2016 analysis of H3.3 K27M upregulated genes. Length of bar indicates p value. (E,F) Plots of H3.3 K27M/H3.3 WT log2 ratio in mouse DIPGs for promoter regions comparing H3K27ac versus H3K27me3 (E) and H3K4me3 versus H3K27me3 (F). H3K4me3 (H3.3 WT, n = 3; H3.3 K27M, n = 2). Shaded density histograms illustrate relative overlap of PTM changes in promoters of up (red) and downregulated (blue) genes compared to the gene loci bulk (gray). (G) Average tracks (identical scale for each genotype pair) showing H3K27me3, H3K27ac and H3K4me3 enrichment in H3.3 WT or H3.3 K27M expressing mouse DIPGs and average RNA-seq tracks for Usp44, Lif and Six1. See also Figures S7 and S8 and Table S6.

