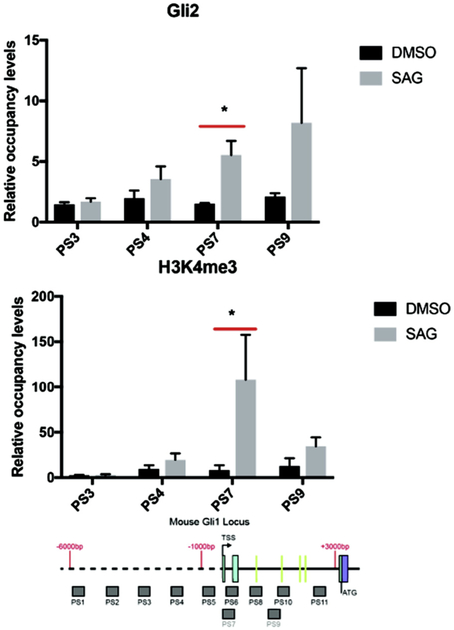
Fig. 4.
GLI2 and H3K4me3 are enriched in the GLI1 locus with SMO agonist (SAG) stimulation in LT2 SHH responsive mouse cells by ChIP-quantitative PCR. The signals were normalized to a control ChIP performed using rabbit IgG. Error bars represent the S.E. of three independent experiments. p values ≤ 0.05 are considered statistically significant and indicated by an asterisk. (Below) a schematic of the mouse GLI1 locus from −6,000 nt to + 3000 nt, relative to the transcription start sites (TSS) is shown. The probe sets (PS) PS1-PS11 are represented as shaded boxes (sequences in Methods section). 5′ - > 3′ is left to right. Green lines in the intron represent the locations of the mouse GBS.

