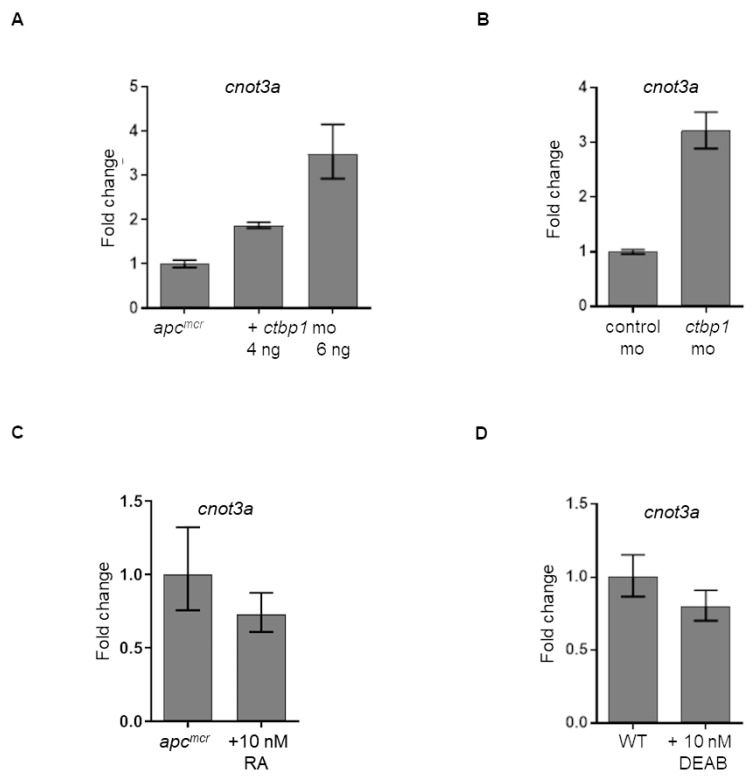
Figure 5. Regulation of cnot3a expression by ctbp1.
(A–D) Graphs showing cnot3a mRNA expression relative to 18s using qRT-PCR assay. mRNA expression of cnot3a in (A, C) apcmcr and (B, D) wildtype embryos after injection of ctbp1 morpholino (mo) (A–B), and after exposure to (C) 10 nM retinoic acid (RA) or (D) RA inhibitor DEAB. Values represent mean ± SD. Graphs shown above is representative of 2 independent pooled embryo samples (3 technical replicates each).

