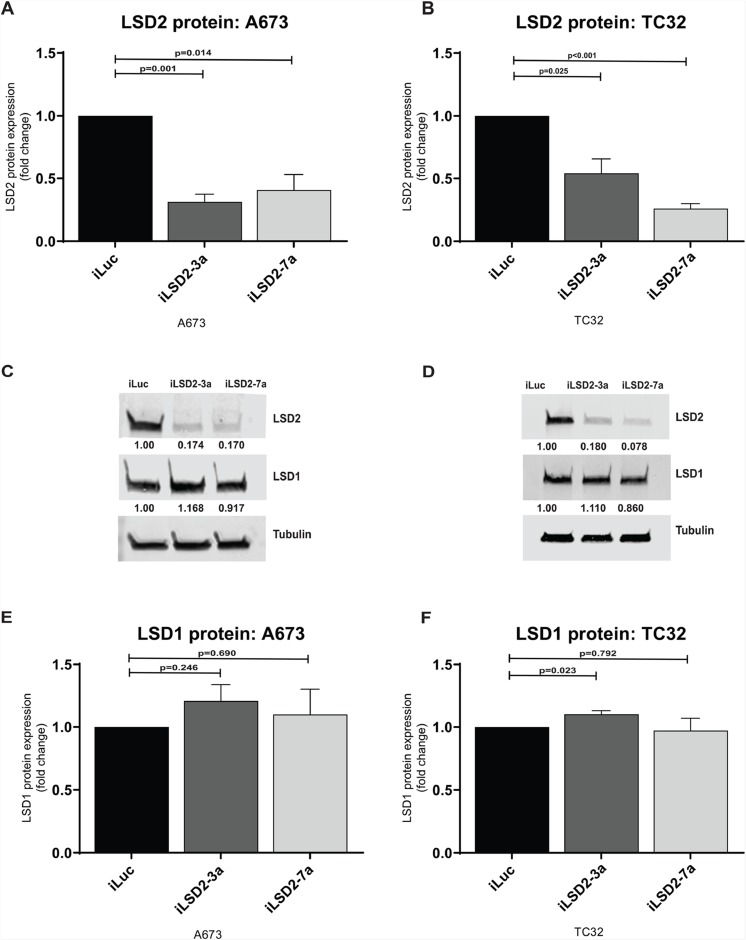
Figure 3. LSD2 protein expression following retroviral knockdown.
(A/B) Densitometry quantification of LSD2 protein levels in A673 and TC32 cells following retroviral infection with either LSD2 shRNA (iLSD2-3a/iLSD2-7a) or control (iLuc) constructs. Cells collected 3 days post puromycin selection. Data represents mean fold change ± SEM compared to iLuc control from 3 independent experiments. (C/D) Representative western blot images of LSD2, LSD1 and α-tubulin (loading control) protein levels from cells described as above. (E/F) Densitometry quantification of LSD1 protein levels from A673 and TC32 cells treated as above.

