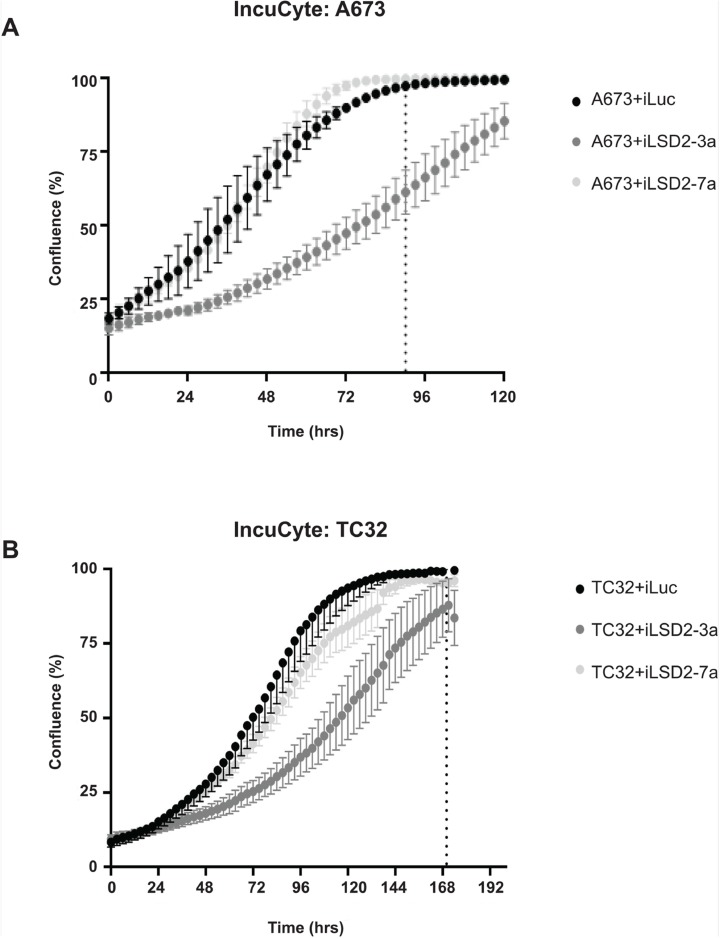
Figure 4. LSD2 knockdown and its impact on Ewing sarcoma cellular proliferation.
IncuCyte proliferation analysis of A673 (A) and TC32 (B) cells following retroviral infection with either LSD2 shRNA (iLSD2-3a/iLSD2-7a) or control (iLuc) constructs. Phase contrast images taken every three hours. Data represents mean confluence ± SEM from 3 independent experiments. Dashed line denotes time taken for iLuc control cells to reach 100% confluency.

