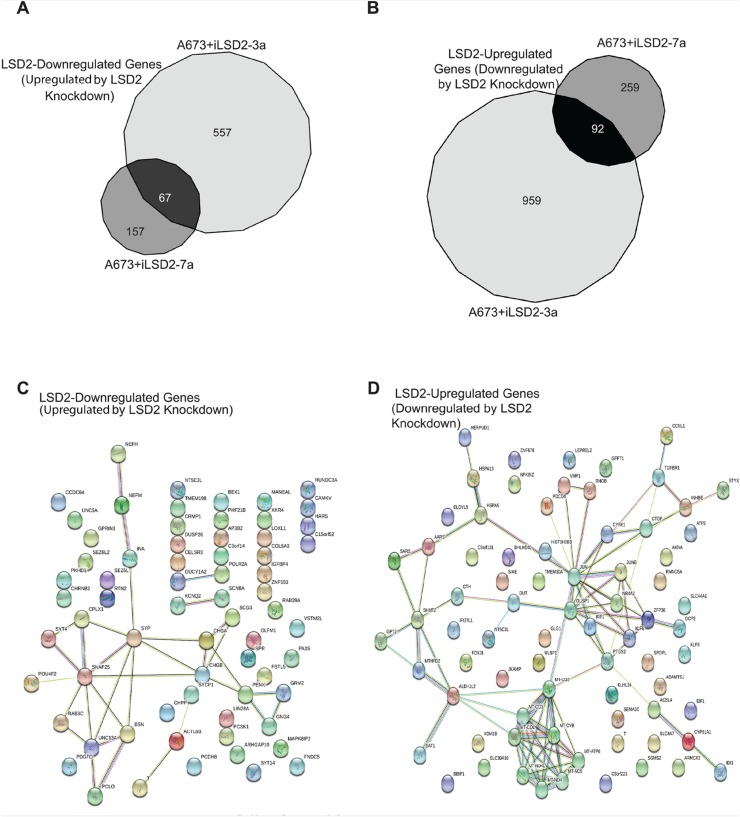
Figure 6. Core A673 LSD2 transcriptional profile.
RNA seq Venn diagram analysis of genes significantly (>1.5 fold change) downregulated (A) and upregulated (B) by LSD2 in A673 cells. STRING pathway analysis of the core LSD2 downregulated (n=67) (C) and upregulated (n=92) (D) genes in A673 cells. The colored nodes represent the inputted proteins into STRING. The colors are automatically assigned by STRING and are used as a visual aid to show the proteins that have a functional relationship with each other (http://version10.string-db.org/help/faq/#are-the-colors-assigned-to-nodes-significant.) Empty nodes represent proteins of unknown structure, while filled nodes are proteins for which the 3D structure is known.

